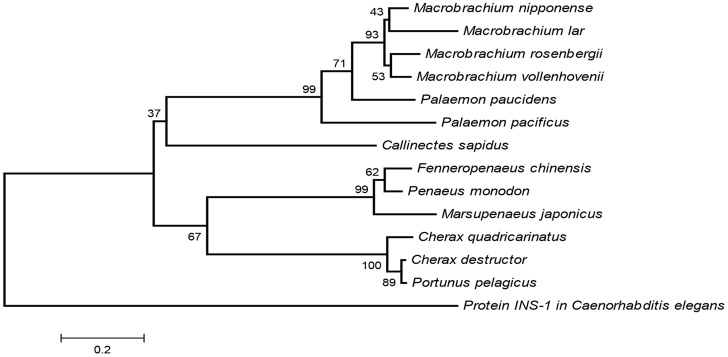
Figure 5. Phylogenetic tree of the IAGs.
The tree is based on the CLUSTAL W algorithm of all known IAGs from decapod crustacean species, calculated and presented by MEGA4 [48]. A C. elegans insulin-like protein serves as an out-group. The numbers on the junctions represent the percentage of attempts, reflecting the specific divergence within 5,000 replicates, while the bar represents the number of amino acid substitutions per site.

