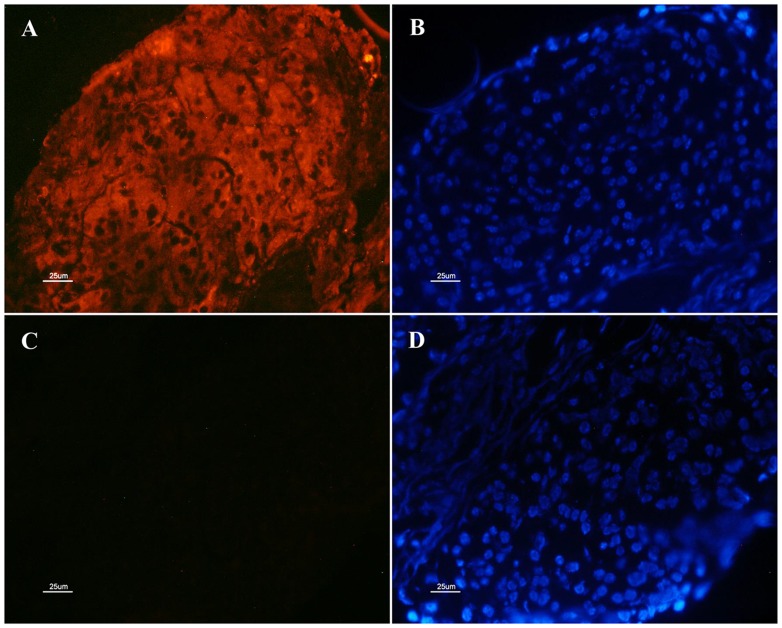
Figure 8. Immunohistochemical localization of Mv-IAG.
The top pictures (A, B) show sections incubated with anti-Mr-IAG anti-serum, while the bottom pictures (C, D) portray controls incubated only with normal rabbit serum. The AG nuclei are stained blue with DAPI (B, D). A specific signal (stained red with Cy3) appears only in the cytoplasm of the treated AG cells (A, top left). No specific signal appears in the negative control sections incubated only with normal rabbit serum (C).

