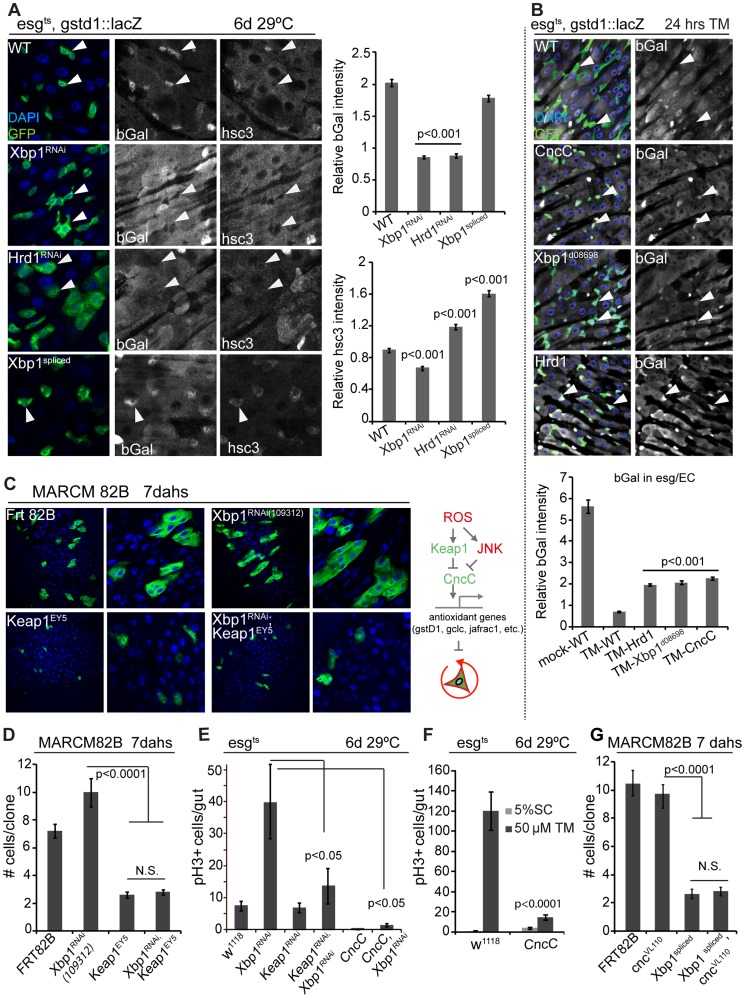
Figure 6. Xbp1 coordinates with Keap-CncC in ISC proliferation.
(A) UPRER influences CncC activity in ISCs/EBs (esgts). CncC activity assessed by bGal expression from the CncC reporter gstd1::lacZ. DAPI, blue; GFP, green; bGal and Hsc3 are shown as separate channels in white. Arrowheads point to individual ISCs/EBs. Quantification of relative bGal and Hsc3 staining shown in the right panel. Ratio of fluorescence intensities in ISCs/EBs and nearby ECs is shown. ISCs/EBs identified by GFP. P values from Student's T test. N = 3. (B) Control of CncC activity by the UPRER in response to tunicamycin treatment. CncC activity assessed by bGal expression from the CncC reporter gstd1::lacZ. DAPI, blue; GFP, green; bGal white, and shown as separate channel in white. Arrowheads point to individual ISCs/EBs. Quantification of bGal staining shown in the lower panel. Ratio of fluorescence intensities in ISCs/EBs and nearby ECs is shown. ISCs/EBs identified by GFP. P values from Student's T test. N = 3. P values from Student's T test. N = 5. (C) GFP-marked MARCM clones for Keap1EY5, Xbp1RNAi109312, Keap1EY5; Xbp1RNAi109312 and wild-type control (Frt82B) at 7 days after heat shock. (D) Quantification of MARCM clone sizes at 7 days after heat shock. Number of clones examined: n = 89 (Frt82B); n = 56 (Xbp1RNAi109312); n = 32 (Keap1EY5); n = 88 (Keap1EY5, Xbp1RNAi109312). Averages and SEM are shown. P values from Student's T test. (E) Increased CncC (by loss of Keap1 or over-expressing CncC) inhibits ISC overproliferation induced by loss of Xbp1 in ISCs/EBs (esgts). Averages and SEM are shown. P values from Student's T test. N = 10. (F) CncC in ISCs/EBs (esg::Gal4,tub::Gal80ts) inhibits tunicamycin-induced ISC proliferation. Averages and SEM are shown. P values from Student's T test. N>10. (G) Quantification of MARCM clone sizes for at 7 days after heat shock. Number of clones examined: n = 102 (Frt82B); n = 99 (Xbp1spliced); n = 23 (CncVL110, Xbp1spliced). Averages and SEM are shown. P values from Student's T test. See also Figure S4.

