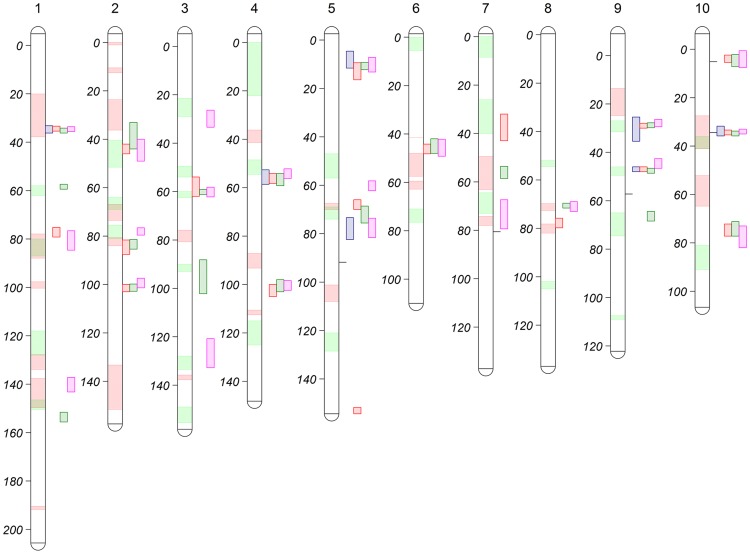
Figure 1. NAM joint-linkage QTL analysis for HR-related traits (LES, HTR, SWR and DTAR) across all the 10 maize chromosomes/linkage groups.
Units on vertical bars are in centi-Morgan (cM) genetic distance. Colored bars on right side of chromosome bar indicate the HR-related trait QTL support intervals: purple- DTAR; red-HTR; green-LES pink-SWR, while green and red segments inside chromosome bars correspond to SLB and NLB resistance QTL support intervals, respectively (Derived from KUMP et al. [34]; POLAND et al. [35]). Horizontal lines on the right side of chromosomes 5, 7,9,10 indicate significant SNP hits for HR-related traits from a previous study (OLUKOLU et al. [27]).

