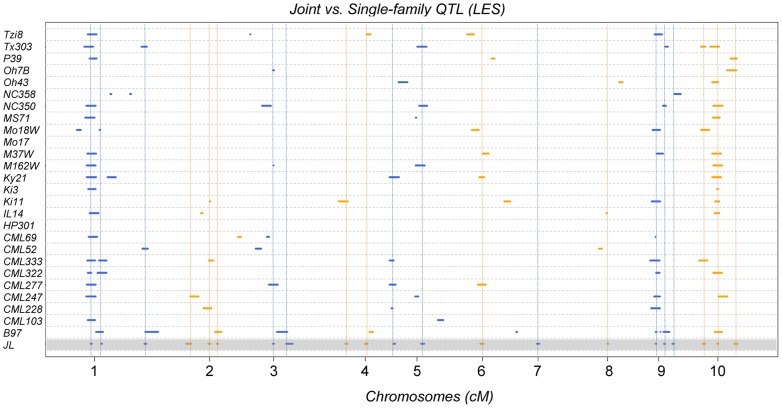
Figure 3. LES QTL obtained from single and joint-linkage QTL analysis across all the 10 maize chromosomes/linkage groups.
Parental inbred lines crossed with the common B73 inbred line to derive each bi-parental sub-population are shown on the vertical axis. The results of joint linakage analysis across the NAM population comprising 24 populations is indicated as JL. The genetic distance for each chromosome is represented in cM (centi-Morgan) unit on the horizontal axis. Different colours are used to indicate alternating chromosomes.

