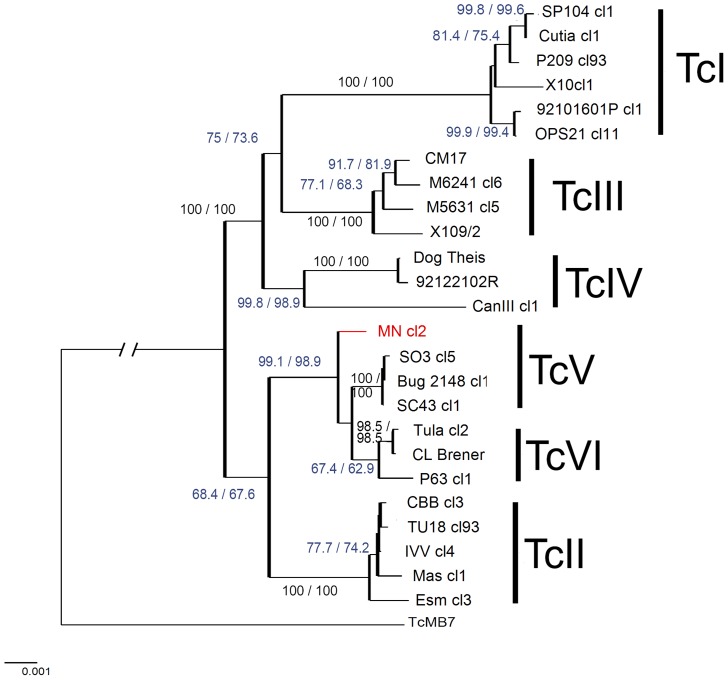
Figure 1. Neighbor Joining tree based on the concatenation of 13 MLST fragments.
Different DTUs are represented by vertical bars. Branch values represent bootstrap values (1000 replications), different bootstrap values indicate the method of handling heterozygous sites: SNP duplication method (first value) and average states (second values). Branch supports highlighted in blue shows branches where support for SNP duplication method was higher than the average states method. The outlier TcV is highlighted in red. Scale bar at the bottom left represents uncorrected p-distances.

