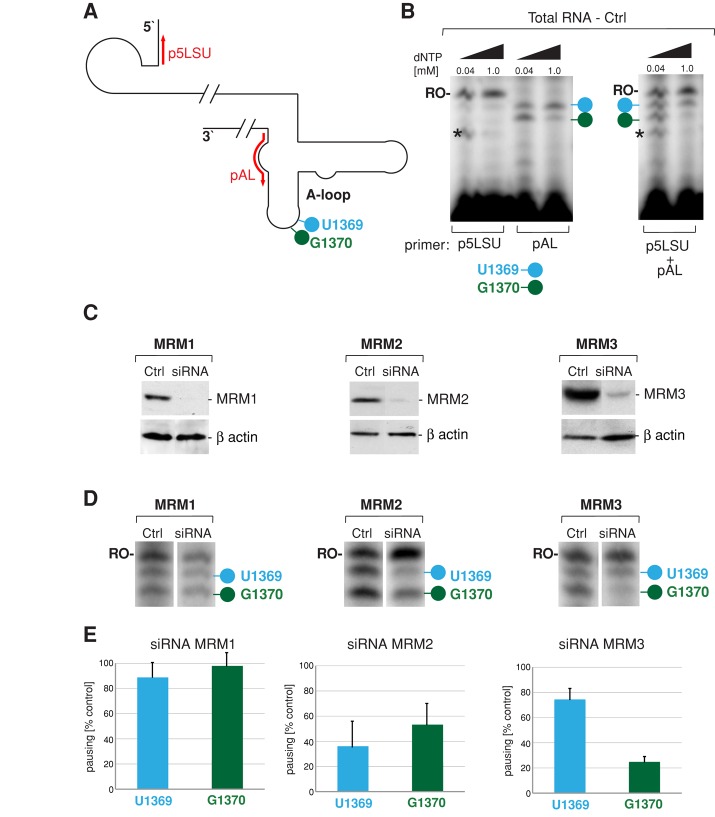
FIGURE 4:
siRNA depletion of MRM2 and MRM3 perturbs LSU rRNA A-loop modifications. (A) Strategy for primer extension to measure levels of the A-loop modifications in human mitochondrial 16S rRNA. The location of primers used for reverse transcription primer extension (RT-PEx) are indicated in red. The pAL primer detects the modifications of U1369 (blue) and G1370 (green), whereas the p5LSU primer is used to standardize the loading of 16S rRNA. (B) Detection of the A-loop modifications of human mitochondrial 16S rRNA in total RNA preparations. Radioactively labeled primers as per A were extended separately (left) or simultaneously (right) in a RT-PEx reaction using total RNA isolated from HeLa cells using two concentrations of dNTPs as indicated. Reaction products were separated on a 15% (wt/vol) denaturing polyacrylamide gel and subjected to autoradiography. The specific pausing sites upon extension of the pAL primer at nucleotide positions U1369 and G1370 are indicated by blue and green lollipops, respectively. RO-, the runoff product resulting from extending the p5LSU primer. The asterisk denotes an unspecified band resulting from RT-PEx of the p5LSU primer using the lower dNTP concentration. (C) RNA interference knockdown of MTases. Steady-state protein levels of the endogenous MRM1, MRM2, and MRM3 proteins analyzed by Western blotting in control HeLa cells transfected with an unrelated siRNA (Ctrl) or cells transfected with selected siRNAs specific for a particular MTase for 9 d. β-Actin was used as loading control. (D) 16S rRNA A-loop modifications upon siRNA knockdown of MRM1, MRM2, or MRM3 Total RNA isolated from control HeLa cells or cells transfected with siRNA to MTases was analyzed using RT-PEx as depicted in A and B. Specific pausing at modified nucleotides U1369 and G1370 is indicated by blue or green lollipop, respectively. The runoff product used for normalization is indicated as RO-. (E) Relative ratios between A-loop–specific and runoff 16S rRNA RT-PEx products in cells treated with siRNA to MTases. RT-PEx reactions as per D were quantified using ImageQuant software, and the ratios U1369/RO and G1370/RO were plotted relative to controls for three independent siRNA transfection experiments. n = 3; error bars, 1 SD.

