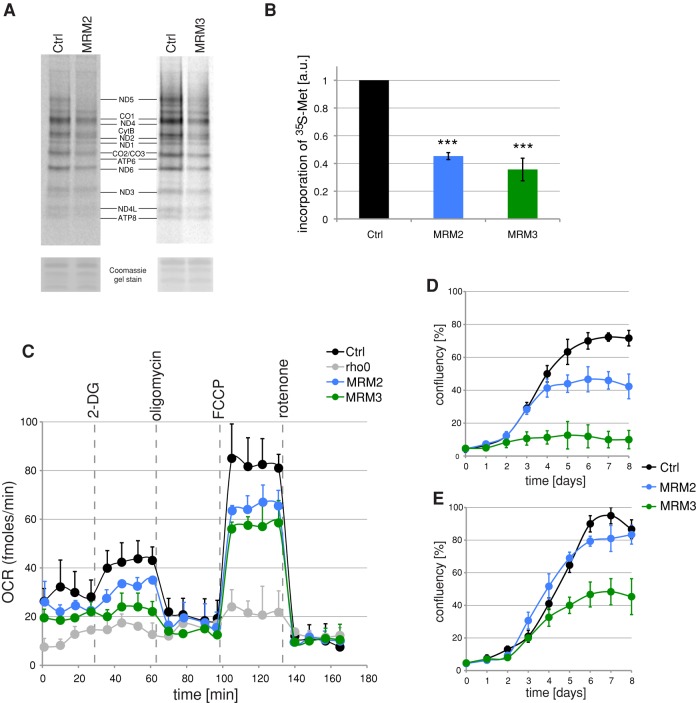
FIGURE 5:
Mitochondrial translation and OXPHOS function after siRNA depletion of MRM2 or MRM3. (A) Mitochondrial translation in cells treated with siRNA to MRM2 or MRM3. Products of mitochondrial translation were labeled with [35S]methionine in control cells transfected with an unrelated siRNA (Ctrl) or in cells transfected for 9 d with siRNAs specific for MRM2 or MRM3. Mitochondrial proteins were separated by 4–12% gradient SDS–PAGE and visualized by autoradiography. To validate equal protein loading, the gel was stained with Coomassie dye. (B) Radiolabeled products of mitochondrial translation as per A were quantified using ImageQuant software after exposure to a PhosphorImager screen. ***p < 0.001; two-tailed Student's t test; n = 3; error bars, 1 SD. (C) OCRs in MRM2- or MRM3-depleted cells. OCR measured in an extracellular flux Seahorse instrument in control cells transfected with an unrelated siRNA or in cells treated with siRNAs to MRM2 or MRM3 for 9 d. The wells were sequentially injected with 20 mM 2-DG to inhibit glycolysis, 100 nM oligomycin to inhibit ATP-synthase, 1 μM FCCP to uncouple the respiratory chain, and 200 nM rotenone to inhibit complex I. n = 4; error bars, 1 SD. (D, E) Cell growth upon inactivation of MRM2 or MRM3. Growth curves obtained by Incucyte kinetic imaging system of parental HEK293 cells (Ctrl) or cells transfected with siRNA to MRM2 or MRM3 for 8 d in galactose (D) or glucose (E) medium.

