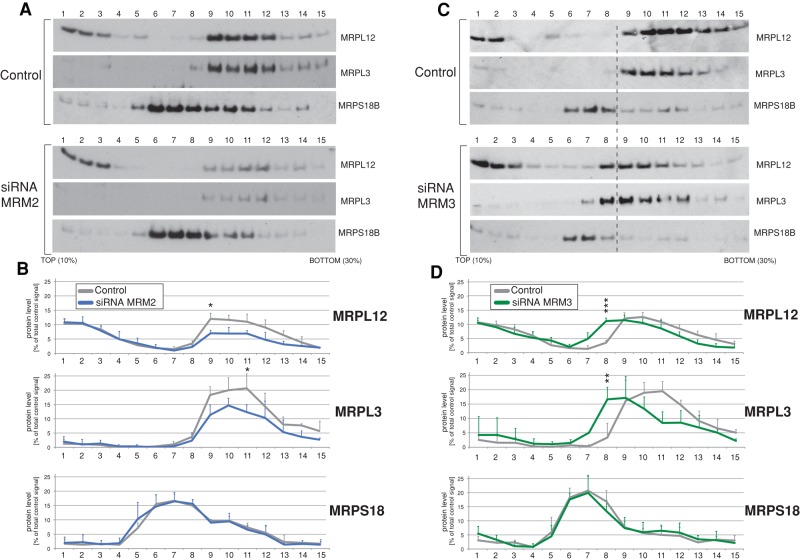
FIGURE 7:
Mitochondrial ribosome integrity upon siRNA depletion of MRM2 or MRM3. (A) The mitochondrial ribosome profile in MRM2-depleted cells. Total cell lysates of control HeLa cells transfected with an unrelated siRNA or HeLa cells transfected with siRNA to MRM2 were separated on a 10–30% (wt/vol) isokinetic sucrose gradient. Fractions obtained for control and RNAi-treated cells were analyzed by Western blotting using antibodies to mt-LSU (MRPL3, MRPL12) and mt-SSU (MRPS18B). (B) Quantification of the gradient distribution of mitoribosomal components upon MRM2 silencing. Western blot signals for MRPL3, MRPL12, and MRPS18B for control and MRM2-depleted cells were quantified using ImageQuant software. The y-axis represents the fraction of the total signal relative to control cells. n = 3. All significant value changes are indicated; *p < 0.05, **p < 0.01, ***p < 0.001; two-tailed unpaired Student's t test. Error bars, 1 SD. (C) The mitochondrial ribosome profile in MRM3-depleted cells. Total cell lysates of control HeLa cells or HeLa cells transfected with siRNA to MRM3 were analyzed as per A. (D) Quantification of the gradient distribution of mitoribosomal components upon MRM2 silencing. Western blot signal was quantified and analyzed as per B.

