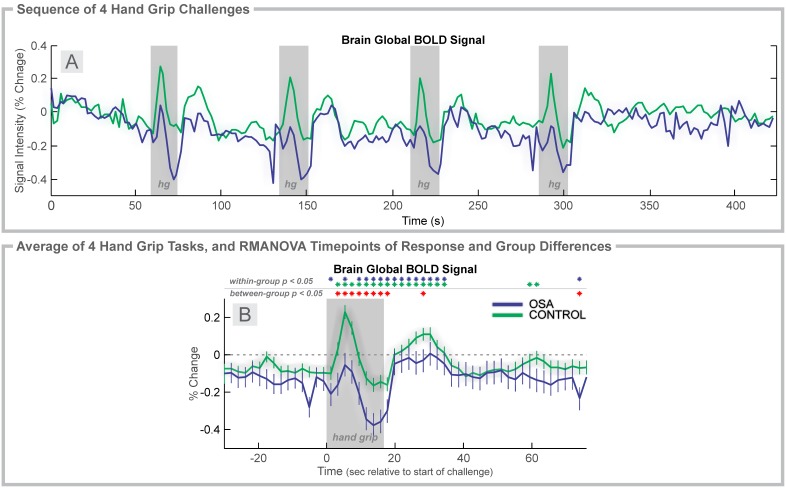
Figure 3. Hand grip, 2 group.
Time course of global BOLD signals over four hand grip challenges (Grip effort; gray rectangles). A: Global BOLD signal in 37 OSA and 57 control subjects during the complete sequence. B: Average over four challenges of percent change in BOLD signals relative to baseline (group mean ± SE), with time-points of significant increase or decrease relative to baseline within-group, and time-points of between-group differences (RMANOVA, p<0.05).

