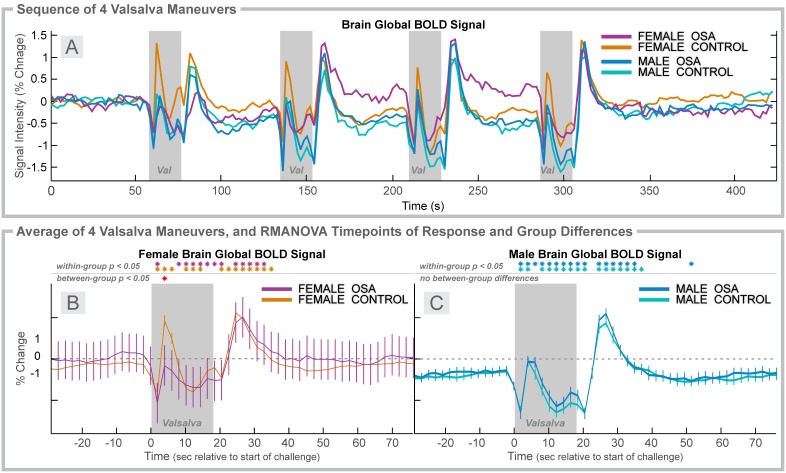
Figure 6. Valsalva, 4 group.
Time courses, separated by sex of heart rate and global BOLD signals over four Valsalva maneuvers (Val; gray rectangles). A: Global BOLD signals in females (6 OSA, 20 control) and males (31 OSA, 37 control) during the complete sequence. For females (B) and males (C), global BOLD signal averages over four challenges of change relative to baseline (group mean ± SE), with time-points of significant increase or decrease relative to baseline within-group, and time-points of between-group differences (RMANOVA, p<0.05).

