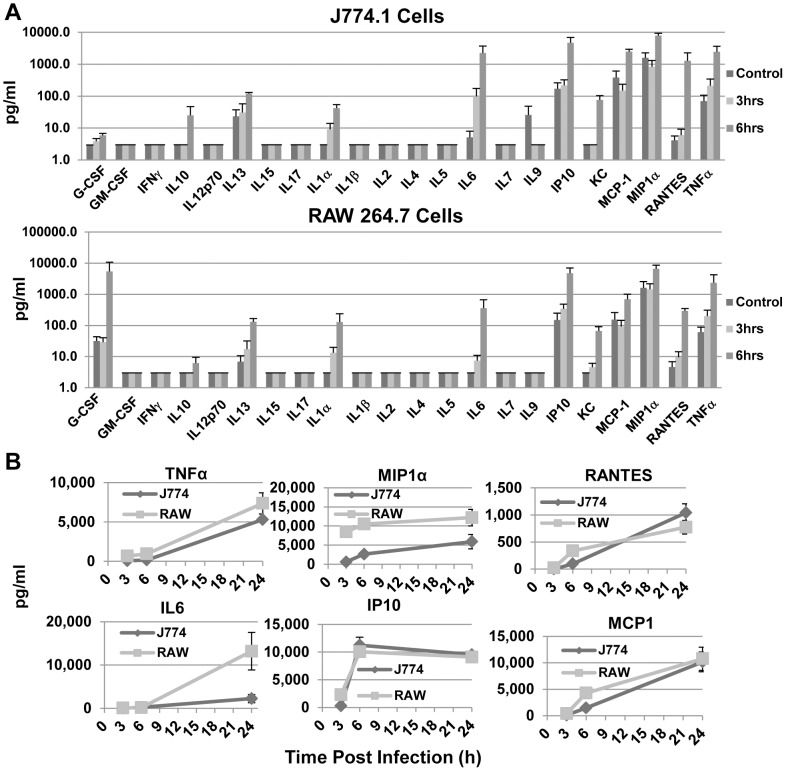
Figure 3. Proinflammatory cytokines are induced by X-31 exposure at early time points post exposure.
A. Supernatants from cells 3 h or 6 h after exposure to X-31, along with those from mock infected controls, were assayed for CK/CHK by multiplexed fluid phased antibody based analysis. Cytokine concentrations were calculated based on known concentration standards run at the same time. Data shown are the mean ± SEM, n = 5 independent experiments. B. Production kinetics of selected CK/CHK induced by FLUA. The charts illustrate commonalities and differences. TNFα and IL6 showed a lag of 3–6 h whereas MIP1α and IP10 were maximal by 3 h. The RANTES and MCP1 responses were intermediate. RAW 264.7 cells responded faster and to higher levels than J774.A1 cells especially at 3 and 6 h pi. Means ± SEM, n = 3 independent experiments.

