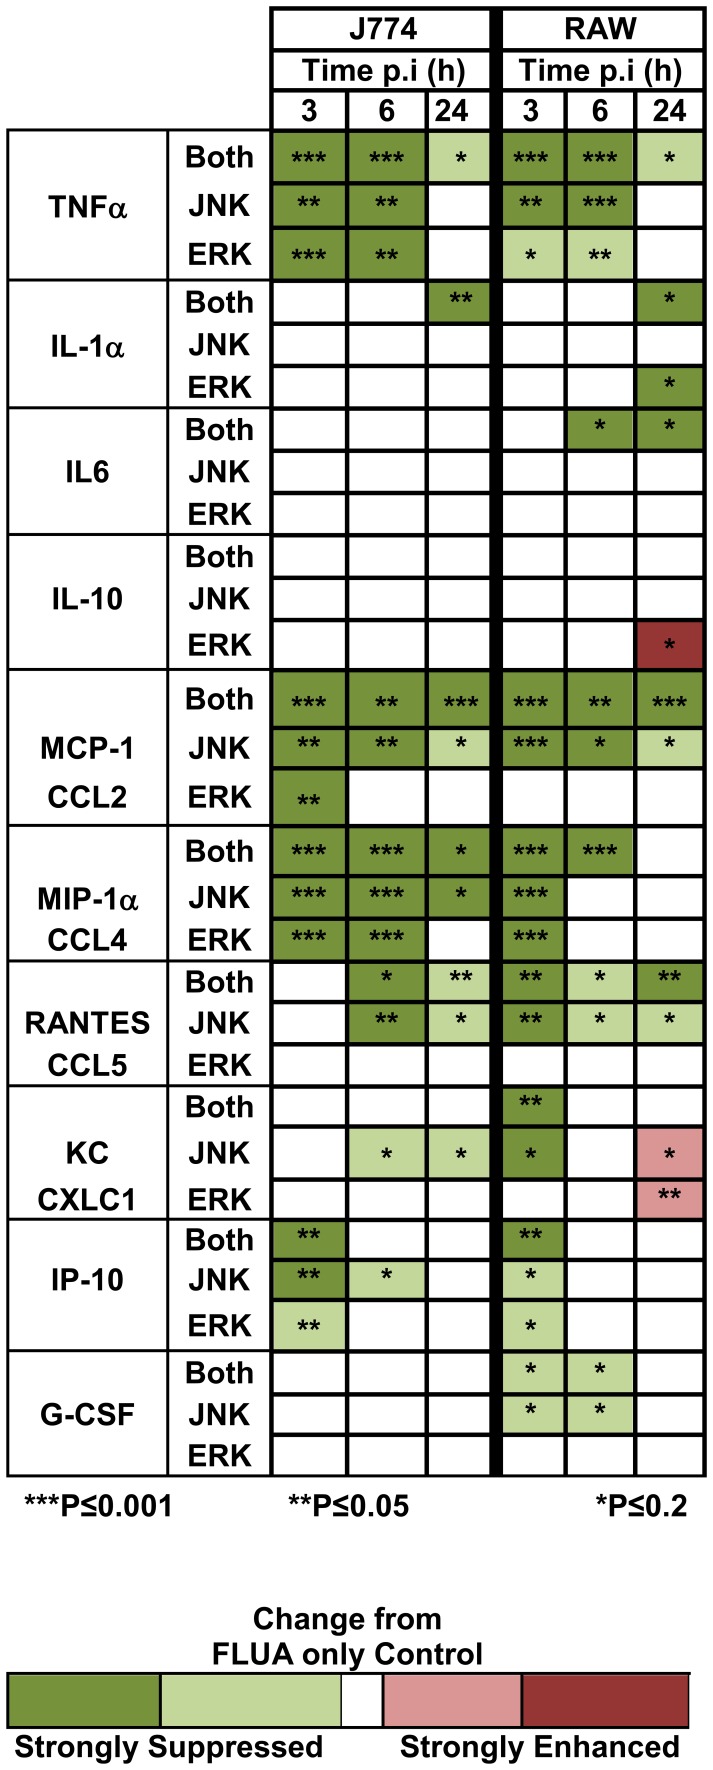
Figure 5. Heat map summary of the effect of MAPK inhibitors on FLUA-induced CK/CHKs.
Supernatants from cells pre-treated with the indicated inhibitors for 1 h then exposed to FLUA were collected 3, 6, or 24 h after exposure, along with those from mock infected controls. They were assayed for selected CK/CHK by multiplexed fluid phased antibody based analysis. Cytokine concentrations were calculated based on known concentration standards run at the same time. CK/CHKs are arranged by family, TNF, interleukins, CCL, CXCL, and growth factors and then in numerical order. Colors are based on the amounts produced compared to controls that received FLUA only. Data are means ± SEM, n = 3 independent experiments. P values are indicated by asterisks: ***P≤0.001; **P≤0.05; *P≤0.2 as determined by t-tests. No color indicates there was no significant effect of the inhibitor. Absolute production levels are shown in Figures 6–9, Tables S1 and 2. FO–FLUA only; JEI–both JNK and ERK Inhibition; JI–JNK inhibition; EI–ERK inhibition.

