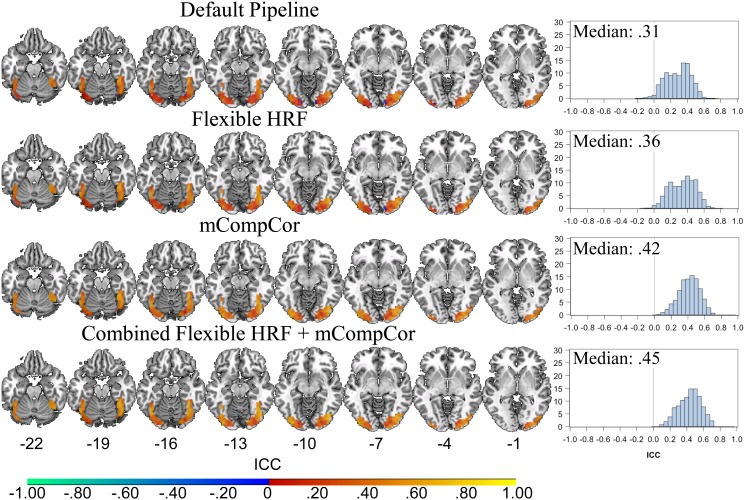
Figure 3. Voxelwise ICC Estimates in Task Related Regions at Time 1 in all Pipelines.
Plotted values on the left represent voxelwise intraclass correlation coefficients (ICCs) in the regions that showed overlapping activity between the four pipelines at time 1. Plots on the right represent histograms of the voxelwise ICCs from the overlap mask, along with the Median ICC for the region. Default pipeline: data were modeled as a block-design with a canonical hemodynamic response function (HRF); Flexible HRF pipeline: data were modeled as a mixed block/event design and temporal and dispersion derivatives were added to the design matrix as additional basis functions; mCompCor pipeline: data were modeled as a block design and a additional regressor was added to the design matrix to account for physiological noise in the global signal; Combined Flexible HRF and mCompCor pipeline: data were modeled as a mixed block/event design and both the Flexible HRF and mCompCor components were implemented.

