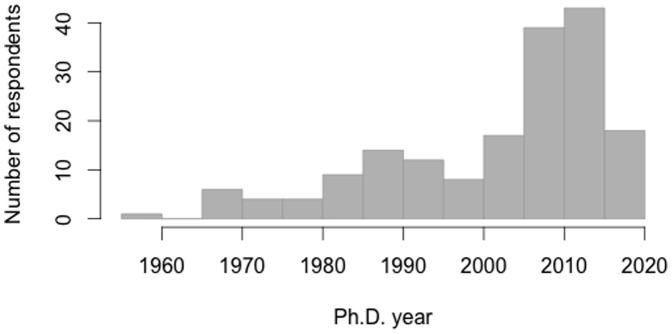
Figure 3. Distribution of survey respondents by year of doctoral graduation.

Histogram representing respondents' year of Ph.D. completion (or expected). (n = 175).

Histogram representing respondents' year of Ph.D. completion (or expected). (n = 175).