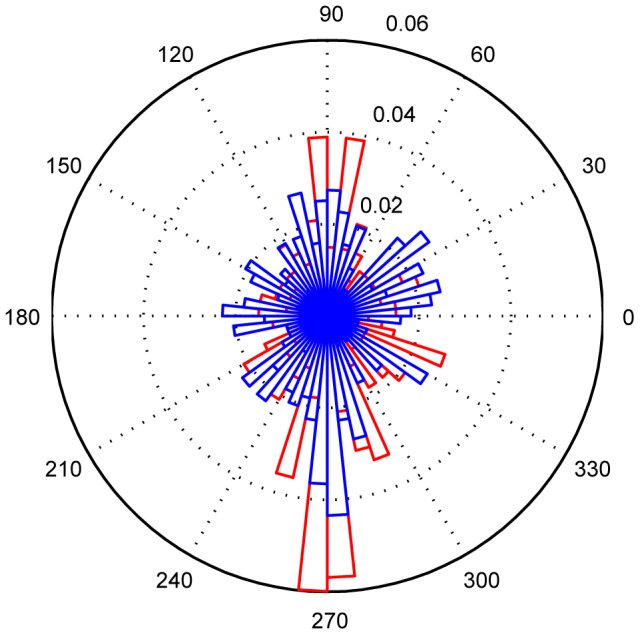
Figure 5. Saccade direction histograms.

Histogram of the directions of eye-in-head movements for susceptibles (red) and controls (blue) during locomotion (all four walks). Movements are depicted in degrees (0° = horizontal movement to the left, 180° = horizontal to the right, 90° = vertical up, 270° = vertical down). Dotted circles (0.01–0.06) represent percentage of eye movements performed in angular ranges of 6°. Susceptibles perform more eye movements in the vertical direction, and fewer in the horizontal direction compared to controls.
