
Figure 7. Gait velocity.
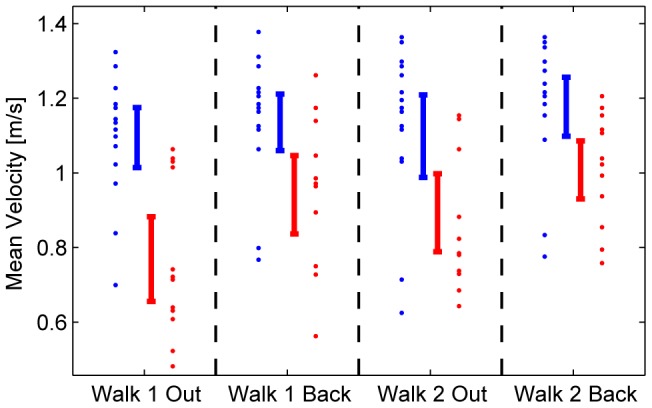
Gait velocity (m/s) in all four walks for susceptibles (red) and controls (blue). Vertical bars denote the confidence intervals for the means during locomotion over a distance of 13.5 m on the balcony. Susceptibles walk slower than controls (p = .001). On the way back, susceptibles speed up; this relative increase in speed was revealed by the marginally significant interaction (p = .07).