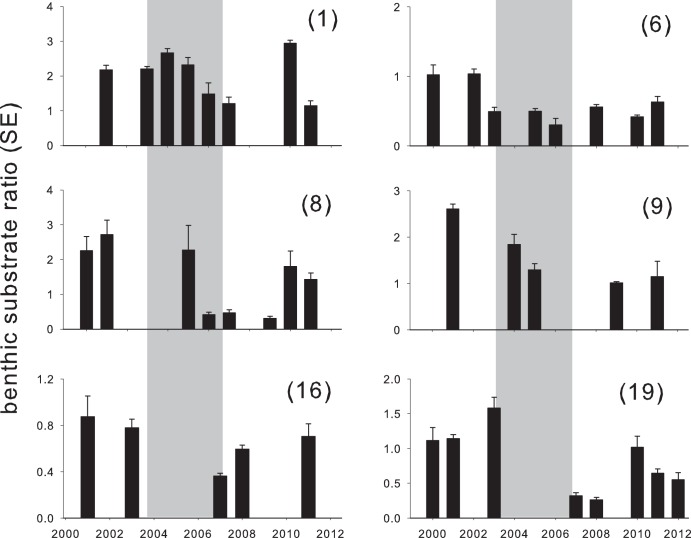
Figure 7. Benthic substrate ratio dynamics for representative monitoring sites around Saipan (sites 1, 9, 8, and 6) and Rota (sites 19 and 16).
See Figure 1 for site identification and Table S3 for trends from all sites. Grey bars indicate the disturbance period. Benthic substrate ratios indicate the proportion of heavily-calcifying versus less-or-non-calcifying substrates (see methods).

