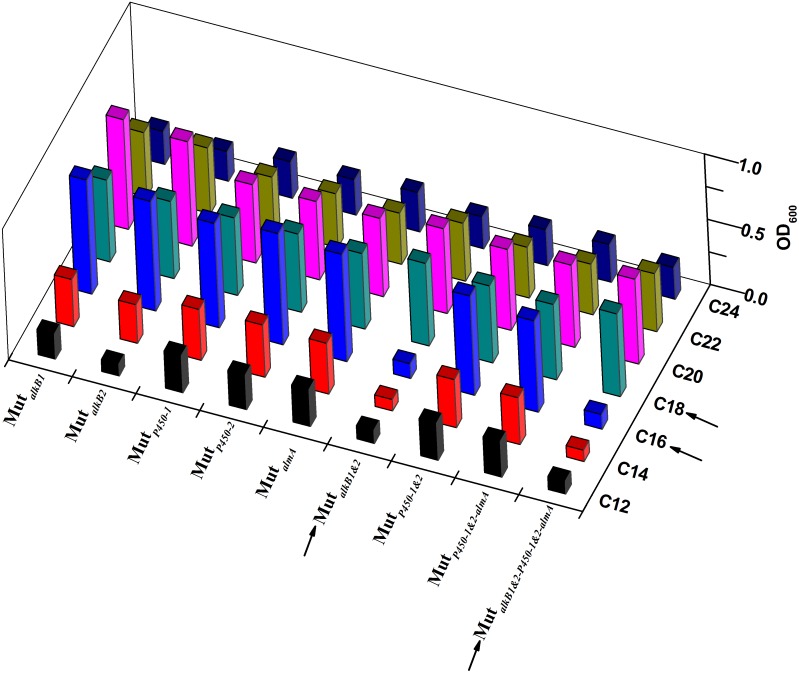
Figure 7. 3D-bar growth representations of all the defective mutants with C12–C24 n-alkanes.
Values on the horizontal axis profile the genotype of the mutants with single or multiple deletions of alkane hydroxylases; The Y-axis specifies the tested n-alkanes, coloring from black to dark blue black. The Z-axis of bar altitudes represents the OD600 for the viability of each mutant. Sharp contrasts were symbolized using arrows when both alkB1 and alkB2 were knocked out, and cultivated in C16 and C18 alkane media, respectively.

