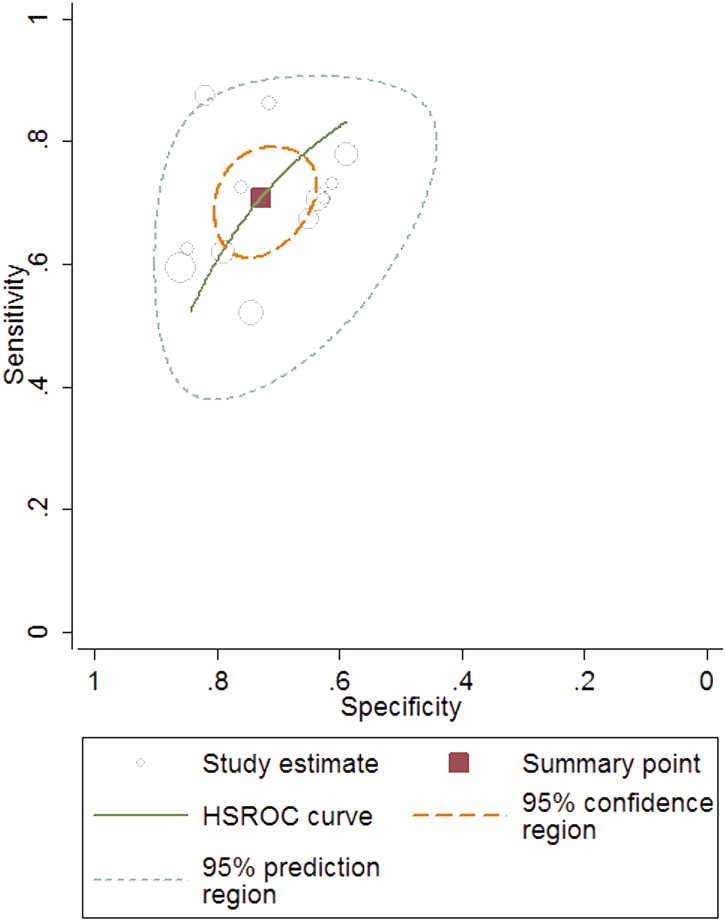
Figure 3. The hierarchical summary receiver operating characteristic (HSROC) curve of FIB-4 index for predicting significant fibrosis.
The size of circles indicates the weight of the individual studies. The marked point on the curve represents the summary sensitivity and specificity. The area delimited by dashed line represents 95% confidence interval of the summary estimate. The area delimited by the dots represents the 95% prediction region, within which there is a 95%confidence that the true sensitivity and specificity of a future study should lie.

