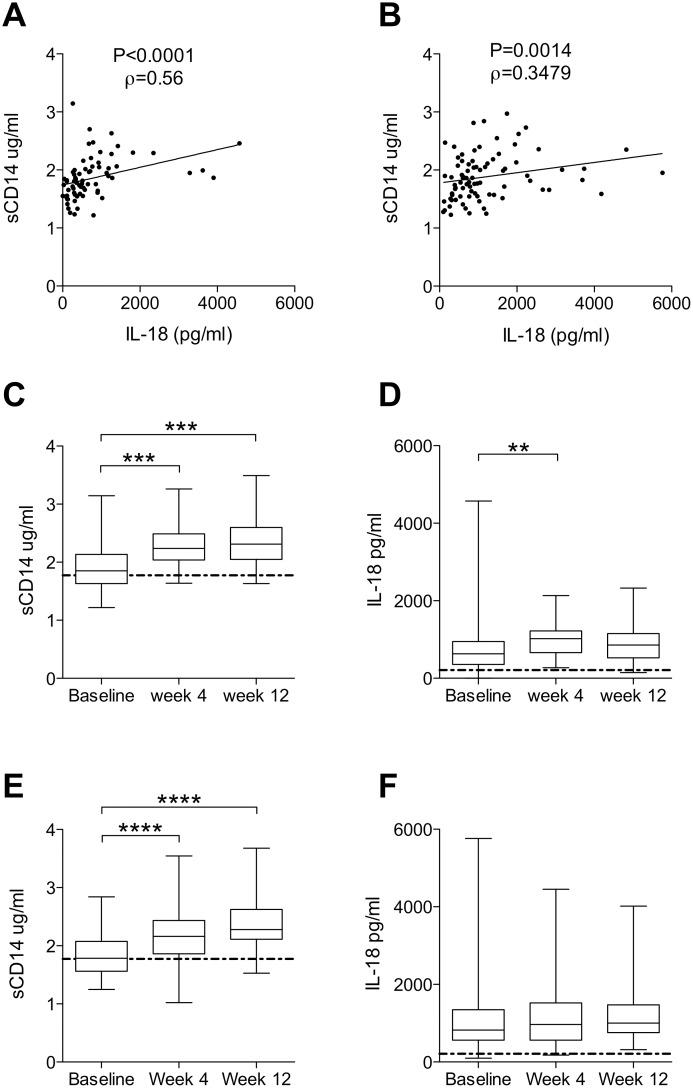
Figure 1. Dynamics of sCD14 and IL-18 over the course of dual and triple therapy.
(A) Correlation of baseline levels of sCD14 and IL-18 in dual therapy patients (n = 72, Spearman rho = 0.5587, P<0.0001). (B) Correlation of baseline levels of sCD14 and IL-18 in triple therapy patients (n = 82, Spearman rho = 0.3479, P = 0.0014). (C) sCD14 over the course of dual therapy (n = 50, Friedman test P<0.0001). (D) IL-18 levels during dual therapy (n = 50, Friedman test P = 0.0019). (E) sCD14 over the course of triple therapy (n = 53, repeated measures ANOVA P<0.0001). (F) IL-18 levels during treatment with triple therapy (n = 53). *P≤0.05, **P≤0.01, ***P≤0.001, ****P≤0.0001 (for Dunn’s comparison or Bonferroni’s comparison were appropriate); dotted line represents untreated healthy control.

