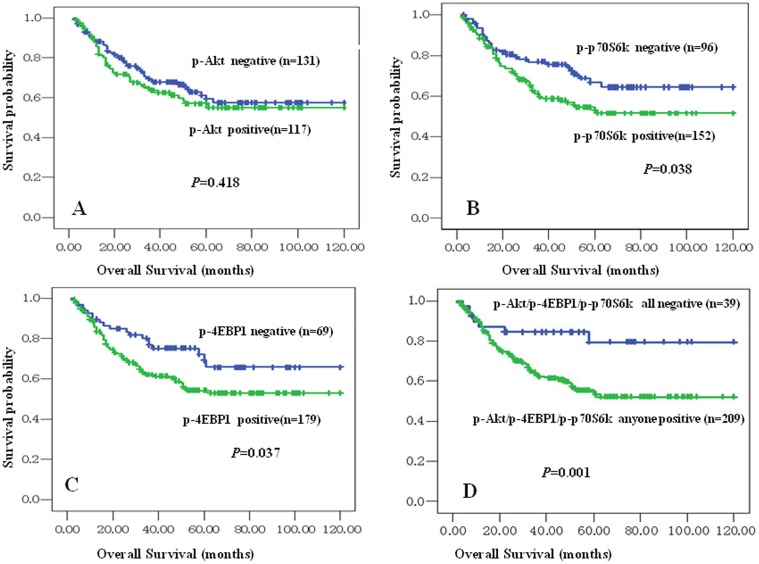
Figure 2. Kaplan-Meier overall survival curves of NPC patients with expression of p-Akt, p-4EBP1 and p-p70S6K proteins and different clinicopathological characteristics.
Kaplan-Meier analysis to plot the survival curve of 248 cases of NPC with expression of p-Akt, p-4EBP1 and p-p70S6K and clinicopathological characteristics and statistical significance were assessed using the log-rank test. Fig. 2A: Positive expression of p-Akt had no significantly correlation with overall survival rates of NPC patients (P>0.05, two sided). Fig. 2B: Kaplan-Meier curves showed worse overall survival rates for NPC patients with positive expression of p-p70S6K protein compared to patients with p-p70S6K negative staining (P = 0.038, two sided). Fig. 2C: Kaplan-Meier curves showed worse overall survival rates for NPC patients with positive expression of p-4EBP1 protein compared to patients with p-4EBP1 negative staining (P = 0.037, two sided). Fig. 2D: Kaplan-Meier curves showed worse overall survival rates for NPC patients with either of p-Akt, p-p70S6K and p-4EBP1 positive expression compared to patients with common negative staining of three proteins above (P = 0.001, two sided).

