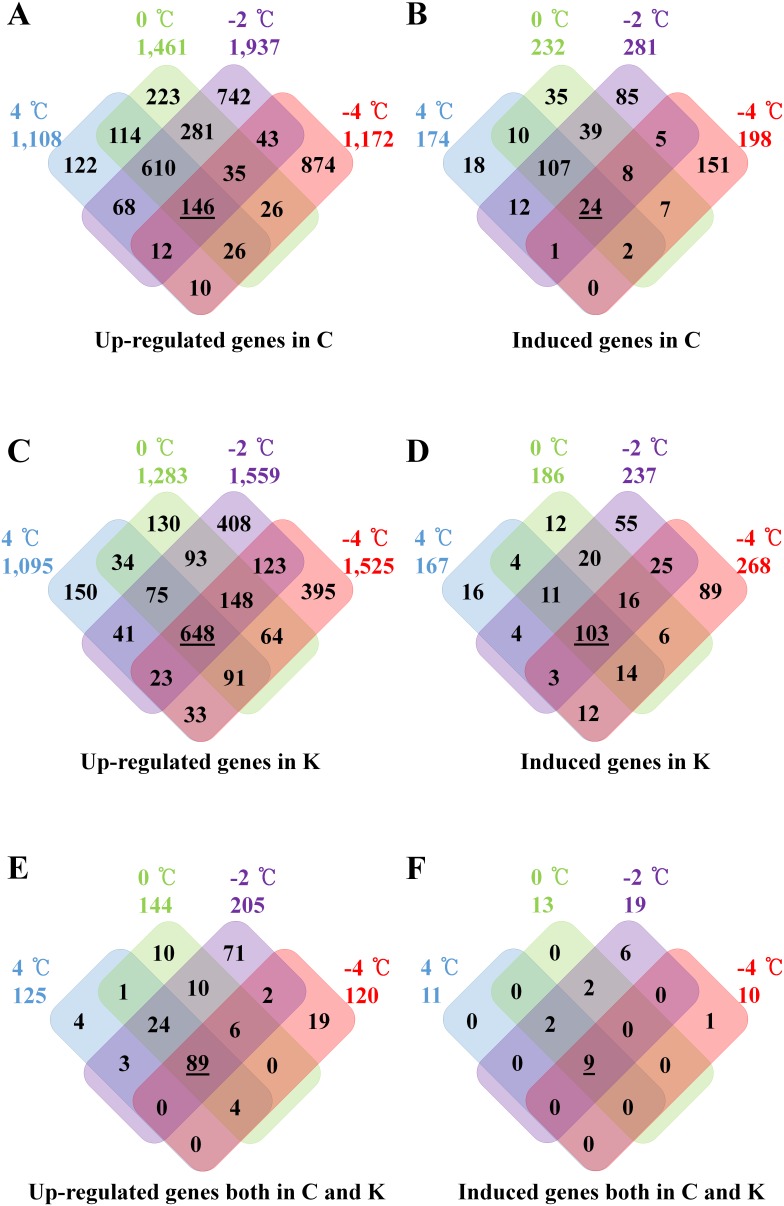
Figure 2. Venn diagram showing up-regulated genes in Chiifu, Kenshin and both upon cold-treatments. C.
and K indicate Chiifu and Kenshin, respectively. A. Venn diagram showing 2-folds up-regulated genes in Chiifu by LT treatment. Underlined number indicates that genes were continually up-regulated from 4°C to −4°C treatments. B. Venn diagram showing induced genes in Chiifu by LT treatment. Underlined number indicates that genes were continually induced from 4°C to −4°C treatments. C. Venn diagram showing 2-folds up-regulated genes in Kenshin by LT treatment. Underlined number indicates that genes were continually up-regulated from 4°C to −4°C treatments. D. Venn diagram showing induced genes in Kenshin by LT treatment. Underlined number indicates that genes were continually induced from 4°C to −4°C treatments. E. Venn diagram showing 2-folds up-regulated genes in both Chiifu Kenshin by LT treatment. Underlined number indicates that genes were continually up-regulated from 4°C to −4°C treatments. F. Venn diagram showing induced genes in both Chiifu Kenshin by cold treatment. Underlined number indicates that genes were continually induced from 4°C to −4°C treatments.

