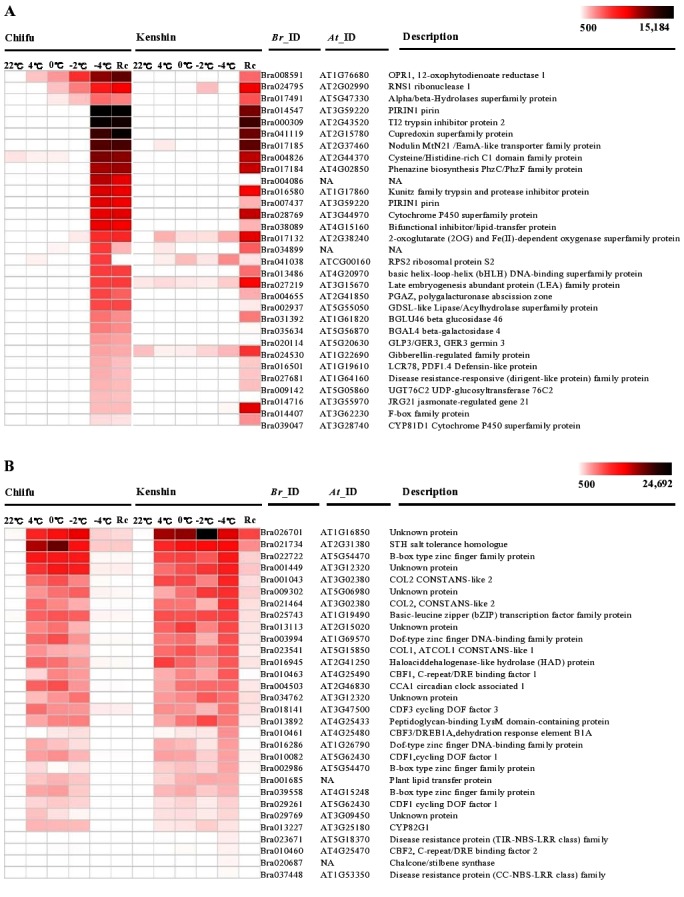
Figure 4. Transcriptome analyses of Chiifu and Kenshin shown by heat maps.

Heat maps of expression profiles of top-30 ranked induced genes upon −4°C treatment in Chiifu (A) and Kenshin (B) were compared. Absolute expression values are scaled by PI values. Detailed transcriptome information was described in Table S9 for Chiifu and Table S10 for Kenshin.
