
Figure 1. Representative visual, Raman and AFM images of the en face db/db vascular wall.
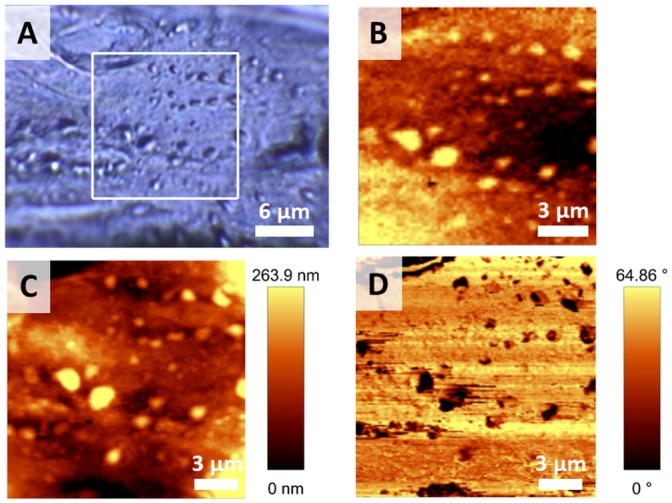
The microphotograph of a studied tissue (100x, A), the Raman distribution image obtained by integration of the band in the 2800–3100 cm−1 range (B) and the complementary topography (C) and phase (D) AFM images.