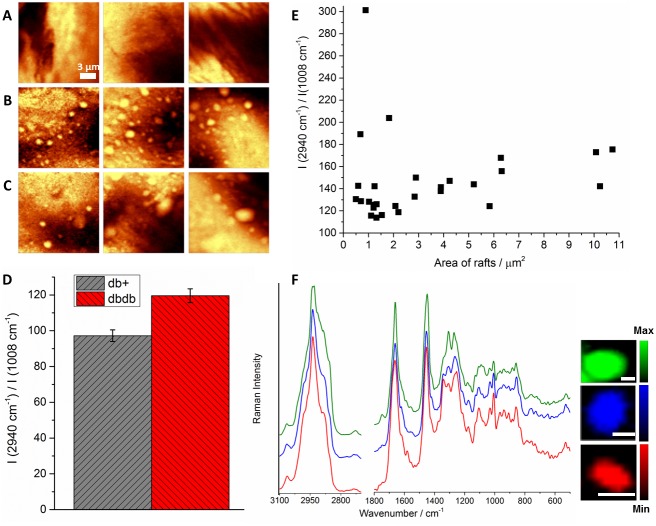
Figure 4. Clustering of lipid rafts in T2DM.
Comparison of the representative Raman distribution images (integration over the band in the 2800–3100 cm−1 range) of the en face endothelium of db+ (control, A), 16-weeks-old db/db (B) and 20-weeks-old db/db (C) mice. The overall endothelium lipid content (defined as the average intensity ratio of the band at 2940 to the band at 1008 cm−1 in all measured db/db or db+ samples; D). The individual lipid content of LRs (defined as the intensity ratio of the band at 2940 to the band at 1008 cm−1 for individual LR assemblies) as a function of their area (E). The correlation between the average spectra of representative LRs and their size (the scale bar denotes 1 µm, the spectra were normalized to the 1011 cm−1 band and offset in order to emphasize the differences between them, the Raman intensity in the 2700–3200 cm−1 range is 3-fold magnified relatively to the fingerprint region; F).

