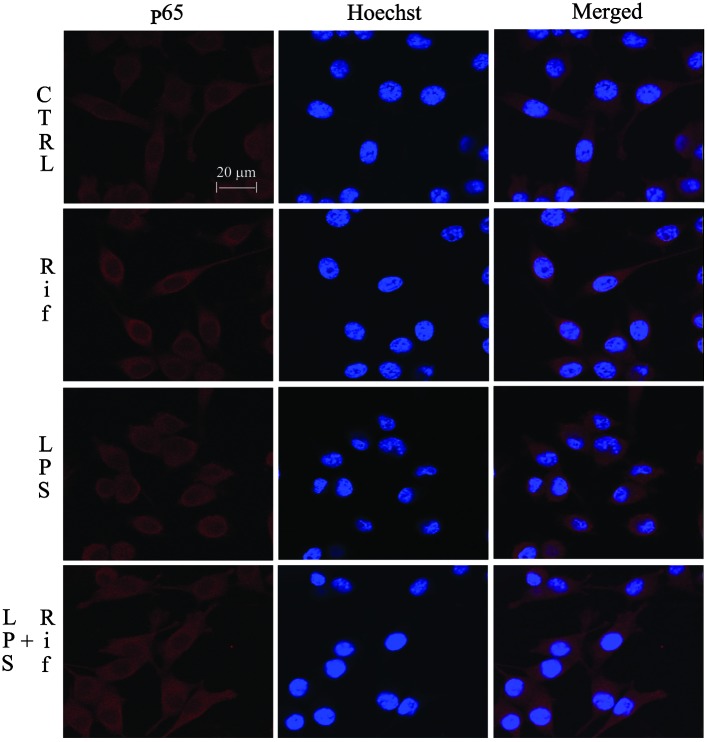
Figure 3.
Inhibition of nuclear factor-κB (NF-κB) activation by rifampicin (Rif) in lipopolysaccharide (LPS)-stimulated BV2 microglia. Immunofluorescent staining showing the cellular distribution of the NF-κB p65 subunit (red). Cells were pre-treated with rifampicin (150 μM) for 2 h, followed by LPS treatment (1.0 μg/ml) for 2 h. Hoechst 33258 (blue) was used to visualize the nuclei. Data were collected from three independent experiments, each carried out in triplicate. Merged, double-stained slides; CTRL, control cells.

