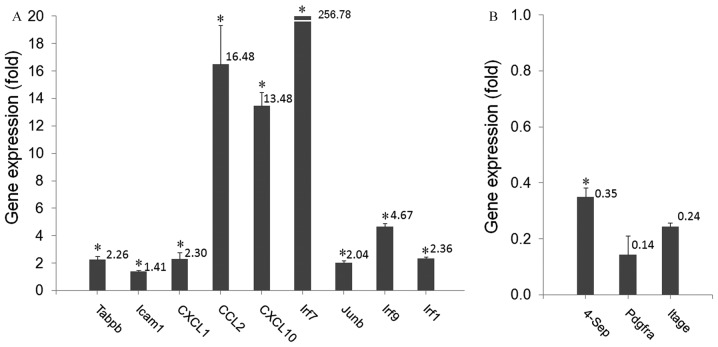
Figure 3.
qPCR of genes with altered expression levels, as identified by microarray analysis. (A) Expression levels of selected McA-RH7777 cell genes upregulated in the presence of iHSCs. (B) Expression levels of selected McA-RH7777 genes downregulated in the presence of iHSCs. Data are presented as the mean ± standard deviation. n=3 in each group; *P<0.05, compared with the control. qPCR, quantitative PCR; iHSCs, induction-activated hepatic stellate cells.

