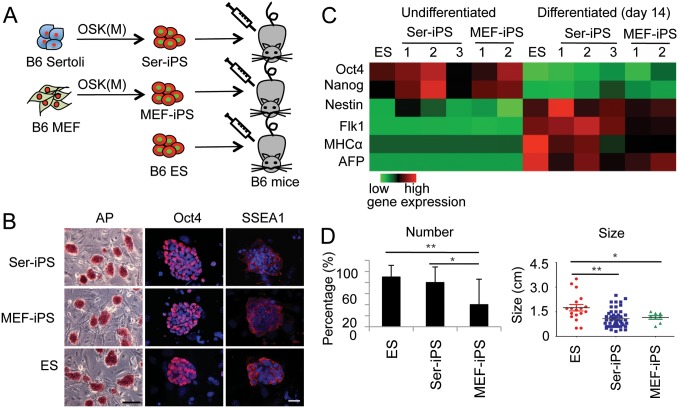
Figure 1. Ser-iPS cells form more teratomas than MEF-iPS cells.
(A) Schematic representation of Ser-iPS cell generation from B6 Sertoli cells by Oct4, Sox2 and Klf4 transfection with and without c-Myc (OSKM or OSK) and teratoma assay in B6 mice. (B) AP staining and analysis of pluripotency markers (Oct4 and SSEA1, red). DAPI staining, blue. Scale bars, 200 µm and 35 µm, respectively. AP staining, Ser-iPS cells (OSKM, clone 1), MEF-iPS cells (OSKM, clone 1) and ES cells (JM8). Oct4 and SSEA1 staining, Ser-iPS cells (OSK, clone 3), MEF-iPS cells (OSK, clone 2) and ES cells (JM8). iPS cell data are representative of all Ser-iPS cells and MEF-iPS cells analyzed. (C) Gene expression in undifferentiated and differentiated Ser-iPS cells (EB assays) determined by qRT-PCR is shown in heatmap format. Expression in undifferentiated ES cells (JM8) was arbitrarily set to 1. Ser-iPS 1 refers to 4F iPS cells (OSKM, clone 1) and Ser-iPS 2 and 3 to 3F iPS cells (OSK, clones 2 and 3); MEF-iPS 1 and 2 refer to 4F and 3F iPS cells (OSKM, clone 1 and OSK, clone 2, respectively). (D) Number and size of teratomas of Ser-iPS cells in B6 mice. B6 MEF-iPS cells and B6 ES cells are shown as controls. Average values of Ser-iPS cells (clones 1, 2 and 3) and MEF-iPS cells (clones 1 and 2) are shown. All Ser-iPS cells and MEF-iPS cells are passage 9–15 (early-passage). *P<0.05, **P<0.01. Bars represent mean ± standard deviation.

