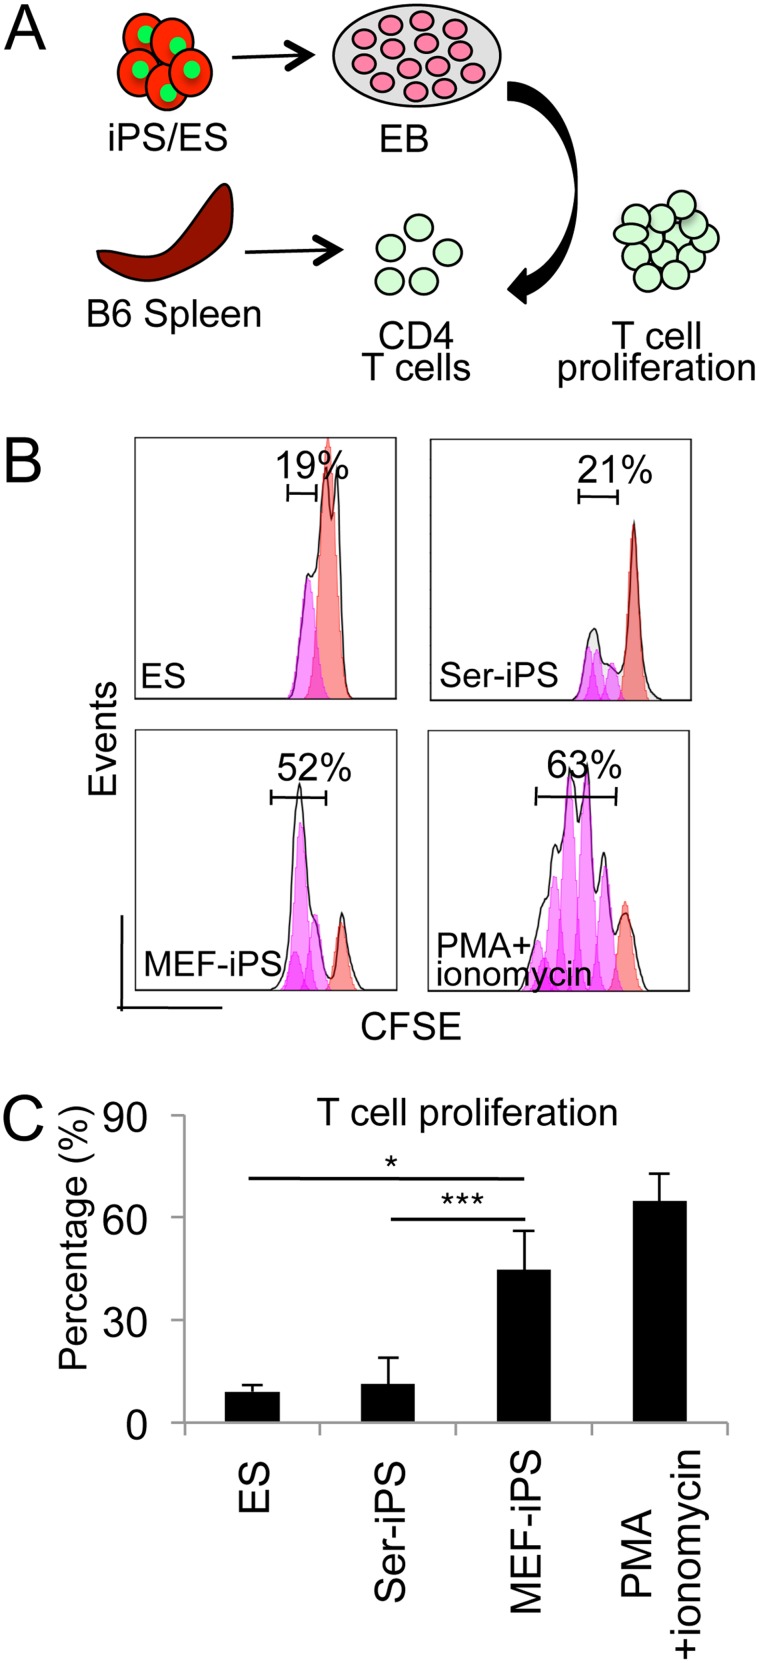
Figure 3. EBs from Ser-iPS cells exhibit reduced CD4 T cell stimulation potential in vitro.
(A) Schematic representation of T cell proliferation assay in vitro. iPS cells or ES cells were induced to differentiate in EB assays (14 days). EBs were co-cultured with splenic CD4 T cells to assess T cell proliferation. (B) Proliferation of CFSE labeled CD4 T cells co-cultured with Ser-iPS cells (day 12–17) in T cell medium. MEF-iPS cells and ES cells were used as controls. Ser-iPS cells (OSKM, clone 1), MEF-iPS cells (OSKM, clone 1) and ES cells (JM8) of Figure 1C. PMA and ionomycin activated T cells, positive control. T cell proliferation refers to the percentage of dividing T cells after 5 days of co-culture. (C) T cell proliferation data after 5 days of co-culture of (B) (n = 3). Average values of Ser-iPS cells (clones 1, 2 and 3) and MEF-iPS cells (clones 1 and 2) are as in Figure 1D. All Ser-iPS cells and MEF-iPS cells are passage 9–15 (early-passage). *P<0.05; ***P<0.001. Bars represent mean ± standard deviation.

