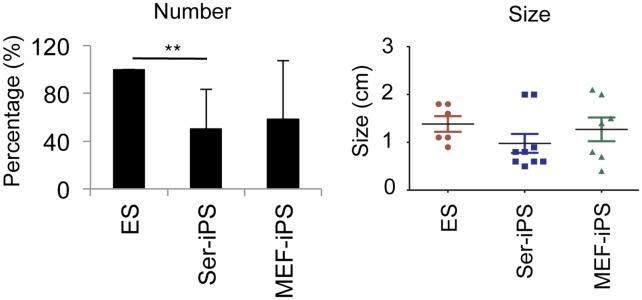
Figure 4. Teratoma formation frequency and teratoma size of late-passage Ser-iPS cells are similar to MEF-iPS cells.

Frequency and size of teratomas of late-passage Ser-iPS cells in B6 mice. Late-passage MEF-iPS cells and ES cells are shown as controls. Average values of Ser-iPS cells (clones 1, 2 and 3) and MEF-iPS cells (clones 1 and 2) are as in Figure 1D. Late-passage: p35–38. **P<0.01. There is no statistical difference in teratoma size. Bars represent mean ± standard deviation.
