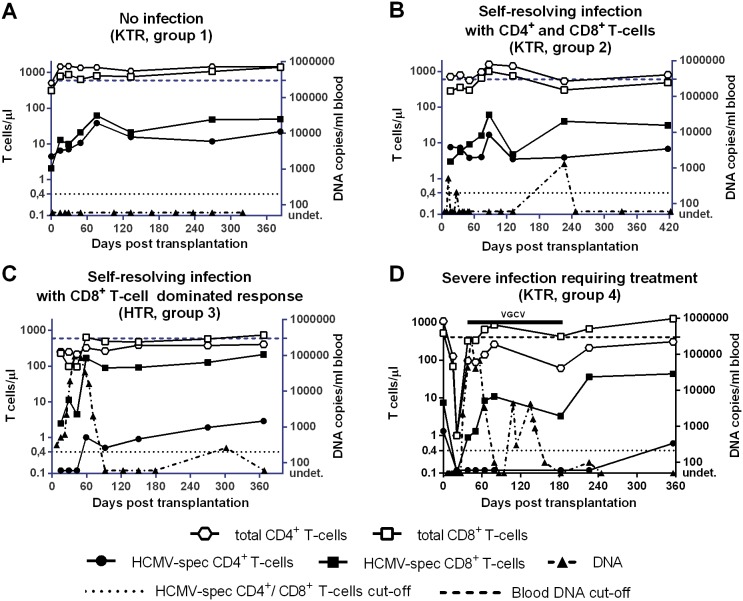
Figure 1. Kinetics of absolute numbers/µl blood of total and HCMV-specific CD4+ and CD8+ T-cells in four SOTR patients (each representative of one of the four patient groups).
Patient A (group 1): no HCMV infection (no viral DNA) is detected and HCMV-specific CD4+ and CD8+ T-cells are consistently above the cut-off (black dotted line corresponding to 0.4 T-cells/µl blood); Patient B (group 2): self-resolving infection in the presence of low viral load and specific CD4+ and CD8+ T-cells consistently above the cut-off; Patient C (group 3): self-resolving infection in the presence of a high viral load peak and a number of HCMV-specific CD8+ T-cells above the cut-off, but in the absence of specific CD4+ T-cells or in the presence of CD4+ T-cells at a level close to the cut-off for the first two-three months after transplantation; Patient D (group 4): uncontrolled infection in the presence of high viral load above the cut-off (requiring antiviral treatment) and absence of specific CD4+ T-cells until 12 months after transplantation. The dashed line indicates the cut-off of viral load to start preemptive therapy. KTR, kidney transplant recipient; HTR, heart transplant recipient; VGCV, valganciclovir.

