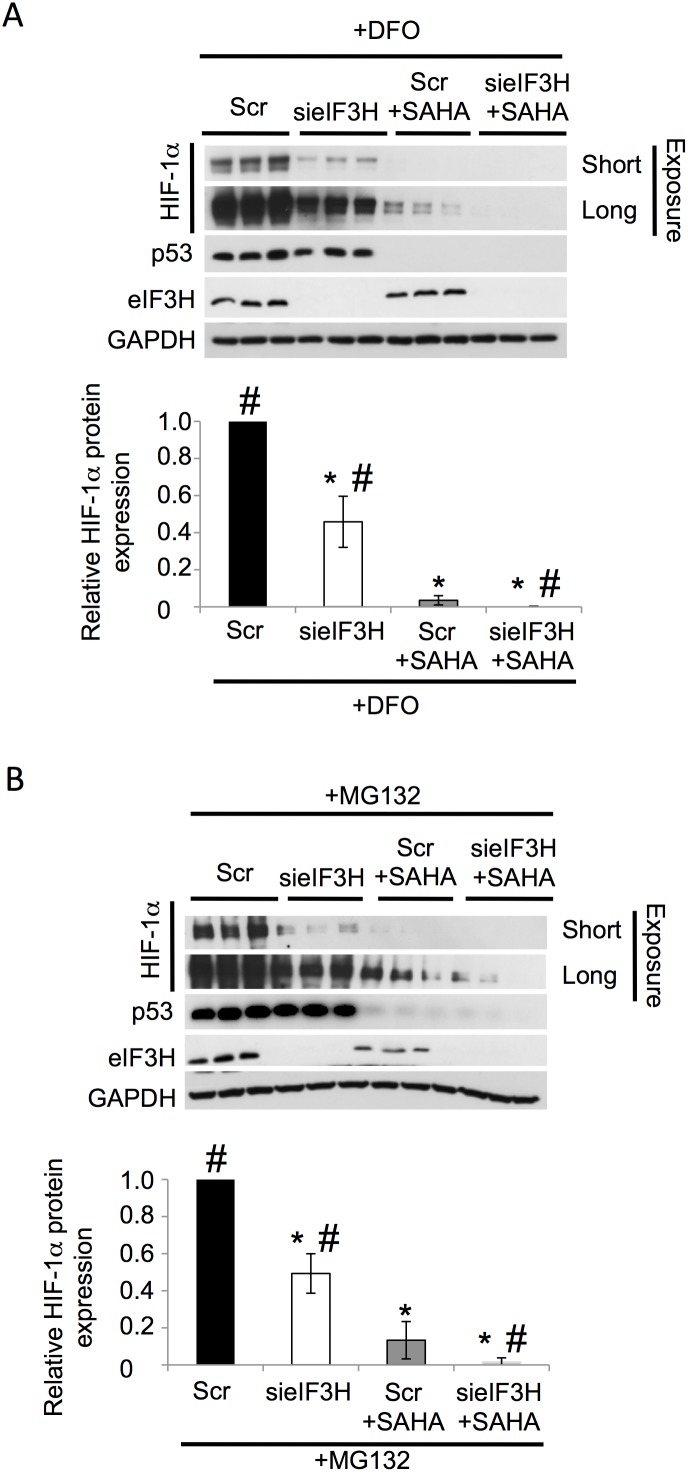
Figure 5. Combined effect of eIF3H silencing and SAHA treament.
(A–B) Immunoblot analysis of HIF-1α, p53, eIF3H and GAPDH protein expression in cell lysates following siRNA-mediated silencing of eIF3H (sieIF3H) in presence or absence of SAHA+DFO (A) or SAHA+MG132 (B) in HuH7 cells. Quantitative analysis of the level of HIF-1α in response to silencing of the indicated eIF3H in HuH7 cells. Data shown denote the fold change in HIF-1α protein expression relative to DFO treatment+Scr control (A) MG132 treatment+Scr control (B) (black bar) (mean ± SD, n = 3). Asterisks indicates p<0.05 as determined by two-tailed t-test using Scr control+DFO (A) or Scr control+MG132 (B) (black bar) as the reference and # indicates p<0.05 as determined by two-tailed t-test using SAHA+MG132 (B) or SAHA+DFO (grey bar) as the reference. In all panels GAPDH is used as loading control.

