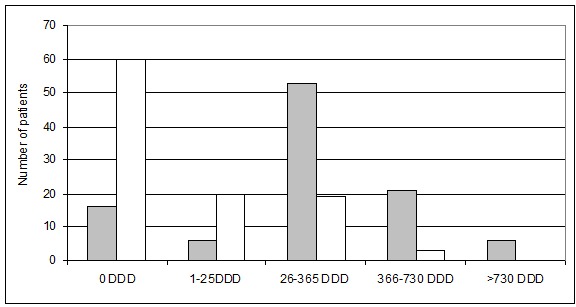
Figure 1.

Distribution grouping of patients’ total use of benzodiazepines and cyclopyrrolones, in defined daily doses (DDD) per year, for patients in both practices; n=102. Only patients associated with the practices for the duration of the intervention are included. The dark columns indicate the distribution prior to the interventions; the light columns indicate distribution subsequent to the intervention.
