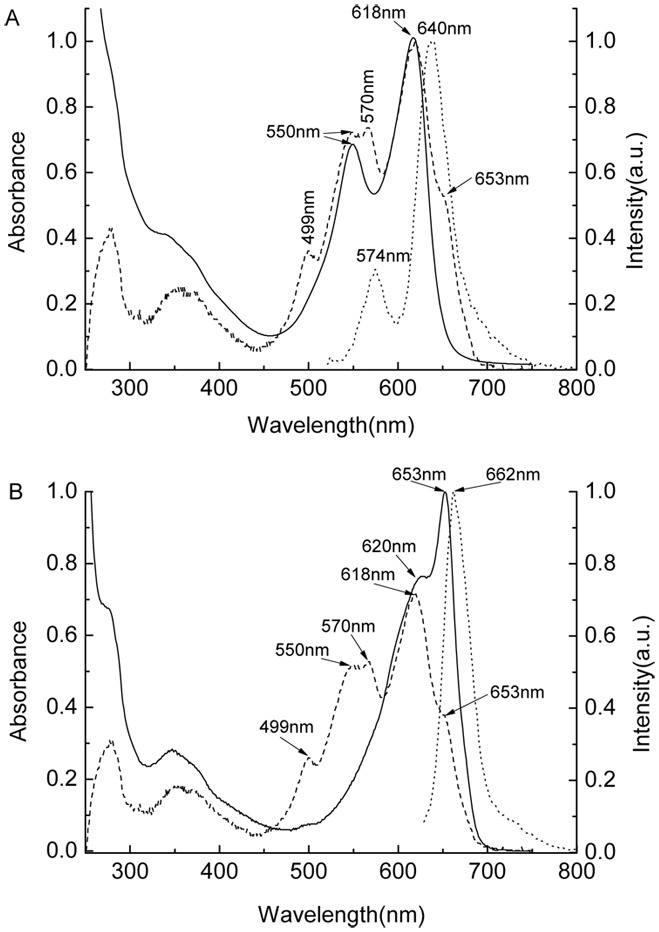
Figure 6. Absorption and fluorescence spectra of the R-PC and AP prepared by the PAGE in the HEPRES−Imidazole/Bis-tris and Bis-tris−HEPES−MES buffer systems.

The absorption (solid line) and fluorescence (dot line) spectra of the prepared R-PCs and APs showed respectively in (A) and (B); the absorption spectrum of the sample, which was obtained by the ion exchange chromatography and used for the PAGE experiments, showed as dash lines both in (A) and (B). The absorption spectra were recorded in pH 7.0 phosphate buffers, and the fluorescence spectra of the R-PC and AP recorded in pH 7.0 phosphate buffer when excited respectively at 500 nm and 615 nm. The specific absorption and fluorescence bands of the R-PC (550 nm and 618 nm, and 574 nm and 640 nm), AP (653 nm and 620 nm, and 662 nm) and R-PE (499 nm and 570 nm) were labeled on the spectra.
