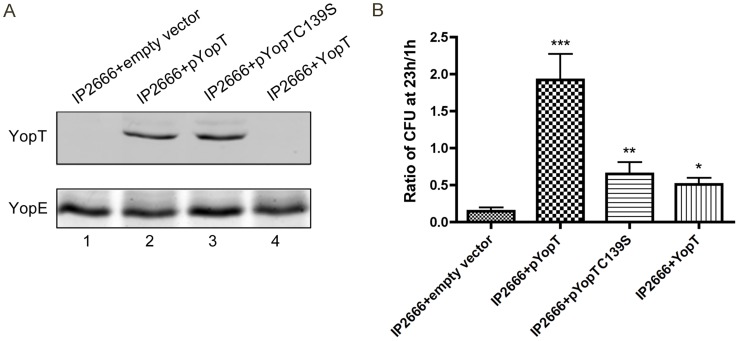
Figure 4. Measurement of YopT production and survival in macrophages by different Y. pseudotuberculosis strains.
(A) Amounts of YopT secreted by different strains as determined by immunoblotting analysis. Indicated strains were grown at 37°C for 4 hours under low Ca2+ conditions. TCA-precipitated supernatants were collected and analyzed using antibodies specific for YopT (upper panel). YopE levels as determined by staining with GelCode Blue Stain Reagent (bottom panel). (B) Intracellular bacterial survival was determined by CFU assay in infected macrophages (MOI of 10), as described in Figure 1. Results shown are the means from four independent experiments with duplicate infection wells. Error bars show standard deviations. ***, P<0.001, **, P<0.01 and *, P<0.05 compared to IP2666+empty vector, as determined by one-way ANOVA.

