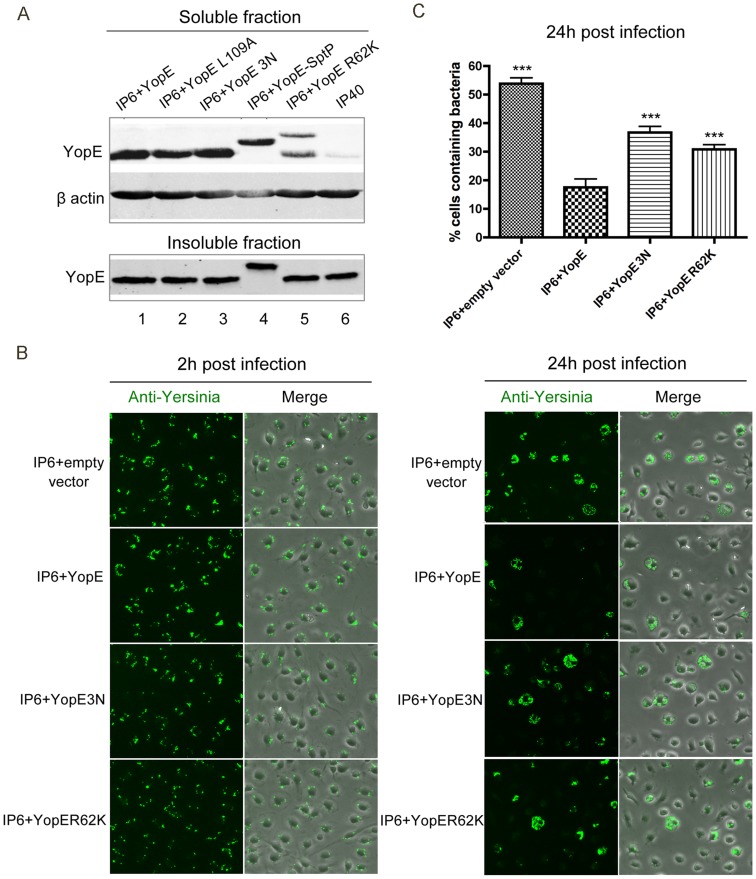
Figure 5. Measurement of YopE translocation and survival in macrophages by different Y. pseudotuberculosis strains.
(A) YopE translocation levels in BMDMs infected by the indicated strains, determined by detergent extraction assay and immunoblotting analysis. BMDMs in 6 well plates were infected at an MOI of 30 for 2 h, then lysed using 1% Triton X-100 buffer. Cell lysates were centrifuged to obtain soluble and insoluble fractions, which were subjected to immunoblotting analysis using antibodies specific for YopE. β-actin levels from the soluble fraction are shown as loading controls. (B) BMDMs were infected with the indicated strains at an MOI of 10, as described in Figure 1. At 2 h and 24 h post infection, infected cells were fixed, permeabilized and labeled with a rabbit anti-Yersinia antibody (green). Shown is bacteria or an overlay of bacteria and phase contrast signal from representative images obtained by fluorescence microscopy. (C) Percentage of macrophages containing fluorescent Yersinia at 24 h post infection, quantified from three independent microscopic experiments as described in (B). Error bars show standard deviations. ***, P<0.001 compared to IP6+YopE, determined by one-way ANOVA.

