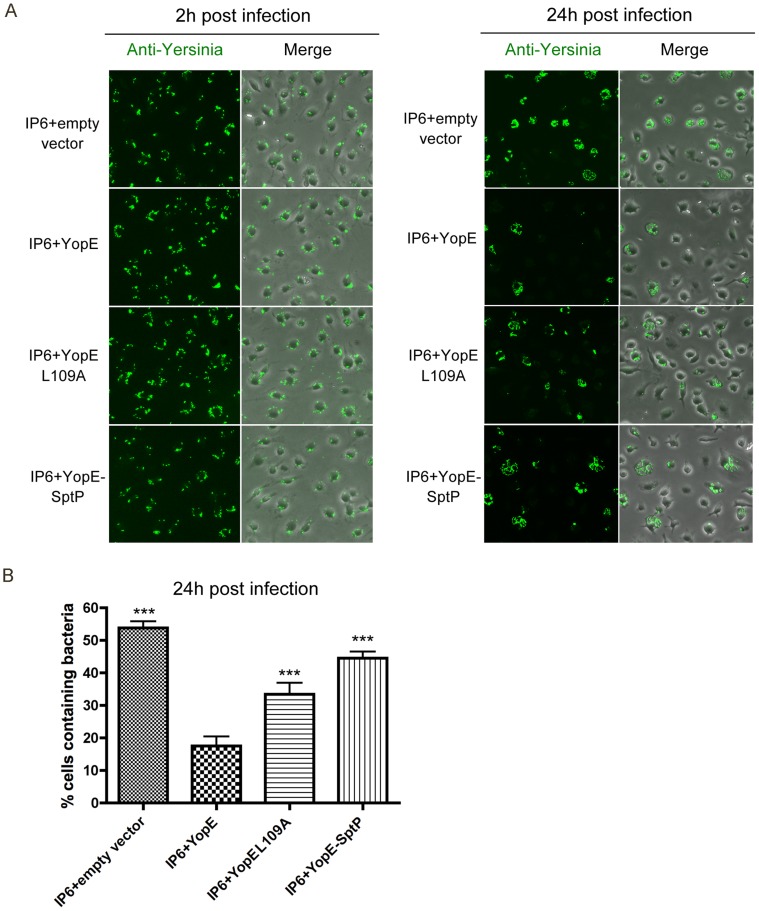
Figure 6. Survival of different Y. pseudotuberculosis strains in macrophages as determined by fluorescence microscopy.
(A) BMDMs were infected with the indicated strains at an MOI of 10 as described in Figure 1. At 2 h and 24 h post infection, infected cells were fixed, permeabilized and labeled with a rabbit anti-Yersinia antibody (green). Shown is bacteria or an overlay of bacteria and phase contrast signal from representative images. (B) Percentage of macrophages containing fluorescent Yersinia at 24 h post infection, quantified from three independent microscopy experiments as described in (A). Error bars show standard deviations. ***, P<0.001 compared to IP6+YopE, determined by one-way ANOVA.

