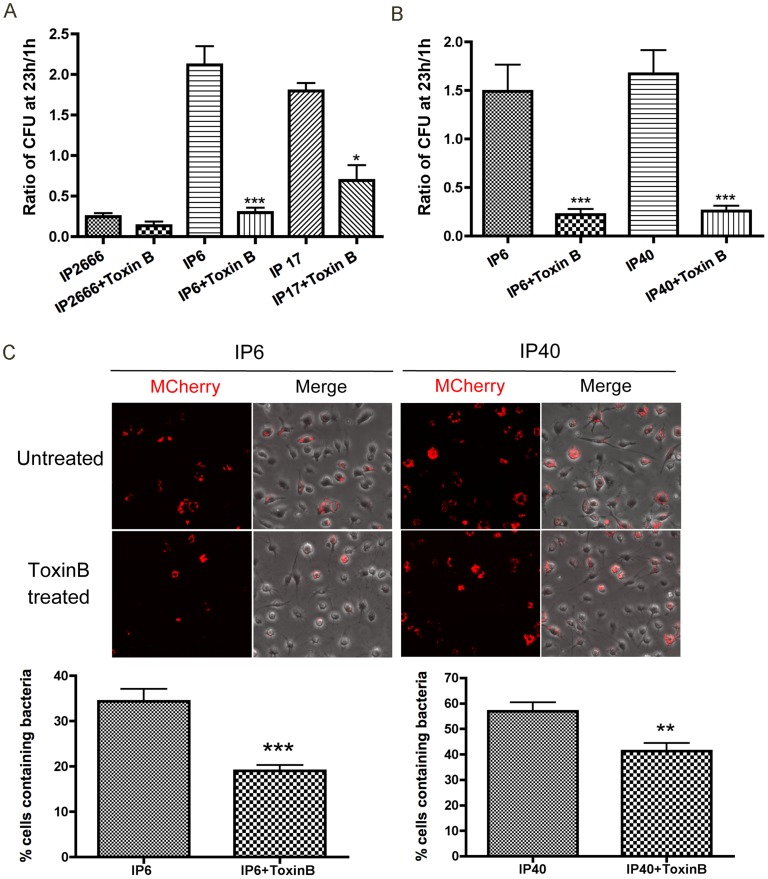
Figure 7. Survival of different Y. pseudotuberculosis strains inside macrophages, in the presence or absence of Toxin B.
BMDMs were infected with the indicated strains at an MOI of 10 as described in Figure 1. When indicated, 40 ng/ml Toxin B was present throughout the experiment. (A–B) Intracellular bacterial survival was determined by CFU assay, as described in Figure 1. Results shown are the means from four independent experiments with duplicate infection wells. Error bars show standard deviations. ***, P<0.001 and *, P<0.05 comparing each strain with to without Toxin B treatment individually, as determined by one-way ANOVA. (C) Intracellular survival of the indicated mCherry encoding strains was determined by fluorescence microscopy as described in Figure 2. Two hours before fixation, IPTG was added to induce de novo expression of mCherry. The upper panel shows mCherry or an overlay of mCherry and phase contrast signal at 24 h post infection, from representative images. The lower panels show percentage of mCherry positive macrophages quantified from three independent experiments. Error bars show standard deviations. **, P<0.01 and ***, P<0.001 determined by t-test.

