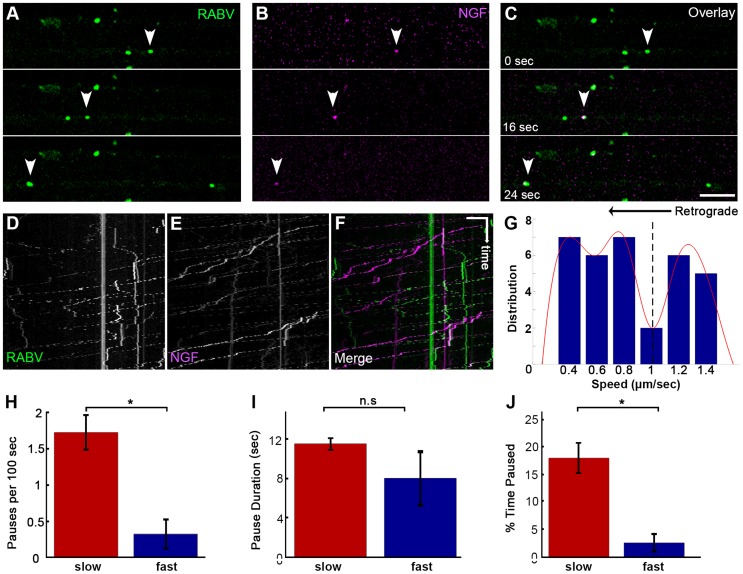
Figure 5. Co-transport of RABV and NGF.
(A–C) EGFP-RABV and Qdot-NGF were simultaneously added to the distal compartment of a DRG explant at 3DIV. Dual-channel live imaging revealed multiple events of RABV co-transported with NGF, illustrated by corresponding images from either channel and overlay. Arrowheads: co-localized puncta trafficked over time. Scale bar = 10 µm. (D–F) Kymographs of EGFP-RABV and Qdot-NGF show mutual transport of RABV and NGF. (G) Two populations of RABV-NGF particles were identified by distribution of average track speeds, as seen by fitted curve (red, minima point represented by dashed line, n = 46). (H–J) “Slow” (n = 38) and “fast” (n = 8) populations according to the minima (1.01 µm/sec) in (G). “Slow” tracks paused more than “fast” tracks (H), and though stop duration was not significantly different (I), spent a larger fraction of their travel paused (J). Data is pulled from two experiments. Error bars represent SEM, *p<0.02.

