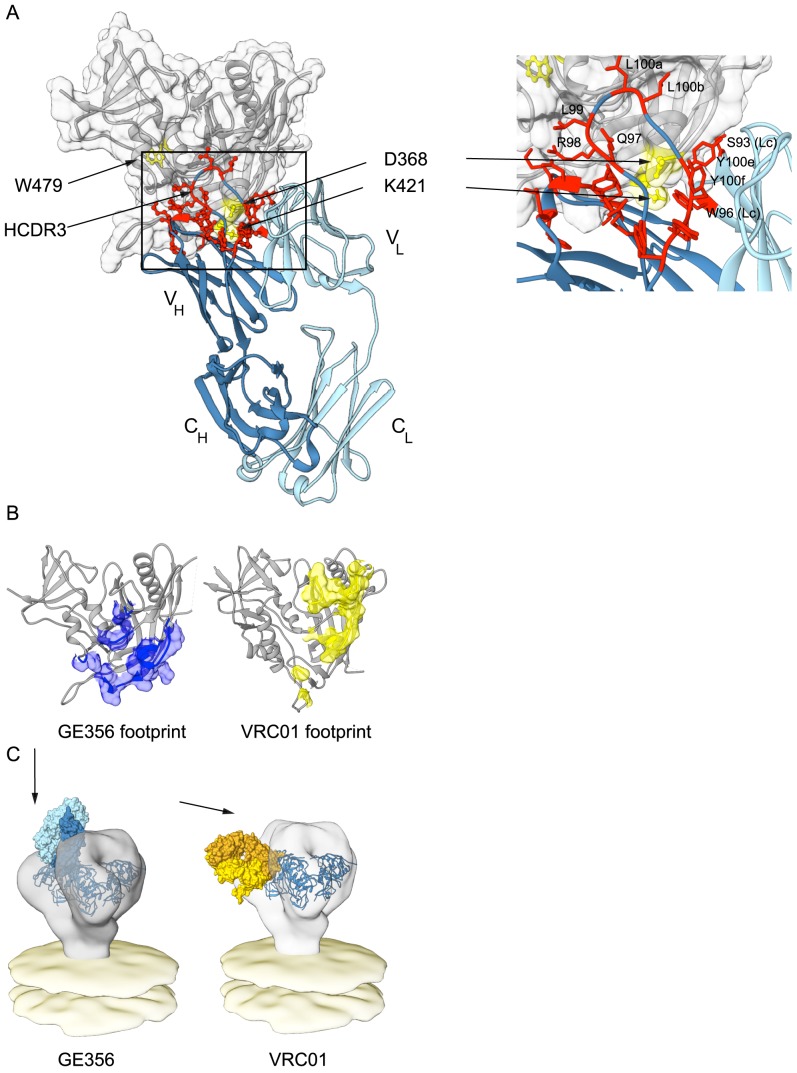
Figure 6. Mapping GE356 binding to gp120, modeling of the GE356:core gp120 complex and fitting to the trimer density.
(A) A panel of JRCF Env mutants containing single Ala point mutations in gp120 was used for a limited alanine scan (Table S5). The three most critical residues revealed by this scan are highlighted on the structure of core gp120 (gray) in yellow and labeled as indicated. A ClusPro model of GE356 in complex with core gp120 was derived from these data and is shown with heavy (dark blue) and light (light blue) chains, docking to the gp120 core. The most critical residues that affect HXBc2 and SF162 neutralization in the antibody paratope from the alanine scan are shown in panel Fig. 5B are mapped onto the structure of the GE356 MAb and are indicated in red. The boxed area shows an expanded view of the most crucial modeled interactions. Residues from the light chain are indicated (LC). (B) Footprint of GE356 (left) compared to VRC01 (right) on the gp120 core structure (gray cartoon representation). The GE356 footprint (blue surface) was obtained by modeling GE356 binding to the b13-bound gp120 crystal structure (PDB ID: 3IDX) with ClusPro 2.0. The VRC01 footprint (yellow surface) on the gp120 core is derived from the crystal structure of the complex (PDB ID: 3NGB). (C) Left, a model of the mode of recognition of GE356 (light chain in light blue and heavy chain in dark blue) by fitting of the GE356:gp120 core into the cryo tomographic density of the unliganded HIV-1 spike [67]. Right, similar fitting of the VRC01 (light chain in light yellow and heavy chain in gold):gp120 core into the viral trimer density (off white).

