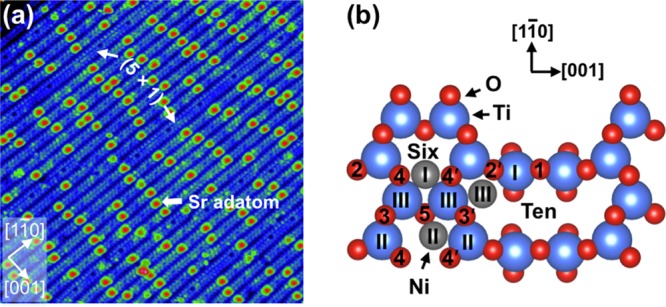
Figure 1.

(a) STM image (30 × 30 nm2, Vsample = +2.0 V, Itunnel = 0.3 nA) of the SrTiO3(110)-(4 × 1) surface. Labeled are Sr adatoms as well as a few stripes that form the (5 × 1) reconstruction.26 (b) Top view of the SrTiO3(110)-(4 × 1) surface. Ti and O atoms are shown in blue and red, respectively. Positions (I–III) for Ni adatoms (gray), attached to surface O atoms, have the most favorable adsorption energies according to DFT calculations.
