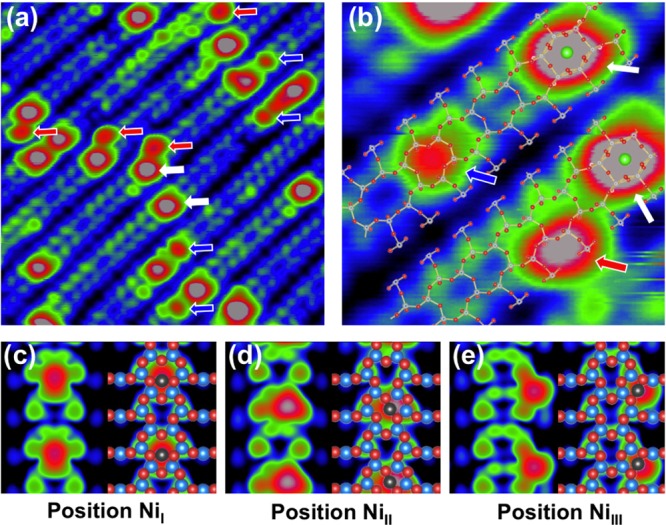
Figure 2.

(a) STM image (10 × 10 nm2, Vsample = +2.0 V, Itunnel = 0.3 nA) of 0.01 Å Ni deposited on the SrTiO3(110) surface at RT. Marked with arrows are Sr atoms (white) and Ni atoms at the center (blue) and side (red) of the rows. (b) High-resolution STM image (3.2 × 3.2 nm2, Vsample = +2.0 V, Itunnel = 0.3 nA) with a structural model superimposed. (c–e) DFT-simulated STM images of single Ni adatoms adsorbed at the center (c) and off-center (d) of the rows (in a six-membered ring) and at the side (e) of the row (in a ten-membered ring).
