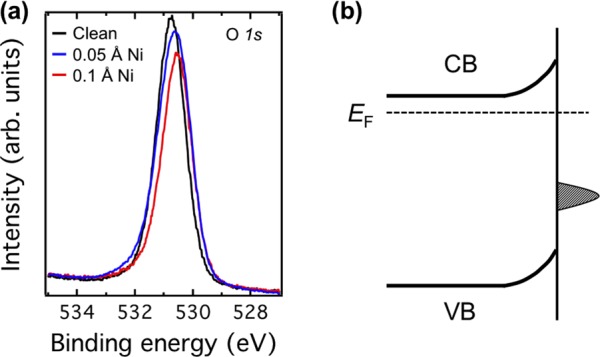
Figure 6.

(a) Comparison of O 1s core-level photoemission spectra of clean surface (black) and surfaces with 0.05 Å (blue) and 0.1 Å (red) Ni adatoms. The spectra are shifted 0.2 eV to lower binding energy after depositing Ni. All spectra were taken with the photon energy of 605 eV at RT. (b) Schematic diagram of the upward surface band bending induced by Ni adatom on the SrTiO3(110)-(4 × 1) surface.
