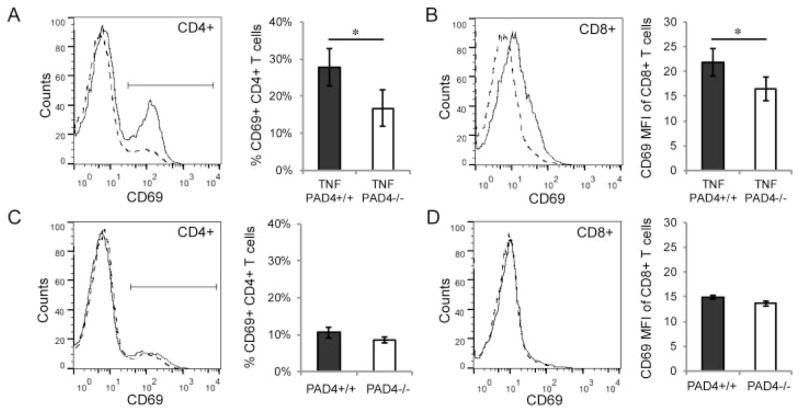
Figure 4.
Reduced T cell activation in PAD4−/− mice with TNFα-induced arthritis. A and B, Spleens of TNF+PAD4+/+ and TNF+PAD4−/− littermates at age 5 months were stained with CD4, CD8, and CD69, analyzed by flow cytometry, and gated on CD4+ and CD8+ cells. CD69 levels on CD4+ cells (A) and CD8+ cells (B) from TNF+PAD4+/+ mice (solid line) and TNF+PAD4−/− mice (dashed line) are displayed on histograms (representative of 6 experiments). Graphs depict the percentage of CD4+ cells that are CD69+ (A) and the mean fluorescence intensity (MFI) of CD69 levels on CD8+ cells (B) (n = 6 littermate pairs). C and D, Similar experiments were performed on PAD4+/+ and PAD4−/− littermates at age 3 months. CD69 levels on CD4+ cells (C) and CD8+ cells (D) from the spleens of PAD4+/+ (solid line) and PAD4−/− littermates (dashed line) are displayed on histograms (representative of 3 experiments). Graphs depict the percentage of CD4+ cells that are CD69+ (C) and the MFI of CD69 levels on CD8+ cells (D) (n = 3 littermate pairs). Values are the mean ± SEM. * = P < 0.05 by paired t-test. See Figure 2 for other definitions.

