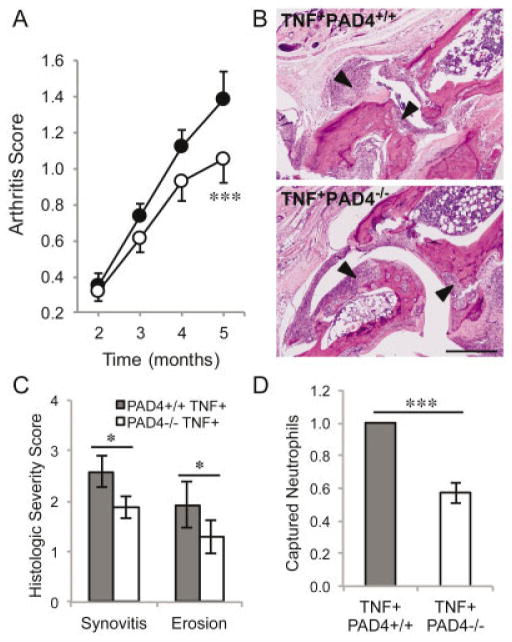
Figure 5.
Reduced arthritis and inflammation in PAD4−/− mice with TNFα-induced arthritis. A, Severity of clinical arthritis was scored in TNF+PAD4+/+ mice (solid circles) and TNF+PAD4−/− mice (open circles). Graph depicts the mean ± SEM of 12 pairs of mice. *** = P = 0.0001 versus TNF+PAD4+/+ mice, by paired t-test. B, Hind legs from TNF+PAD4+/+ and TNF+PAD4−/− littermates at age 5 months were assessed histologically. Images are representative of 12 pairs of mice and show inflamed synovium/pannus invading cartilage and bone (arrowheads) at the tibiotalar joint. Original magnification × 100. Bar = 200 μm. C, The extent of synovitis and erosion at the tibiotalar joint was scored in a blinded manner on a scale of 0–4, and the graph depicts the mean ± SEM (n = 12 pairs of mice). * = P < 0.05 by paired t-test. D, Blood from TNF+PAD4+/+ and TNF+PAD4−/− mice at age 5 months was pipetted into Kit-On-A-Lid-Assay microfluidic devices. Neutrophils were captured by the P-selectin–coated surface and counted. All experiments were performed at least in triplicate. Graph depicts the mean ± SEM number of captured neutrophils from the TNF+PAD4−/− mouse normalized to the number from the TNF+PAD4+/+ littermate in 7 experiments. *** = P < 0.0001 by unpaired t-test. See Figure 2 for definitions.

