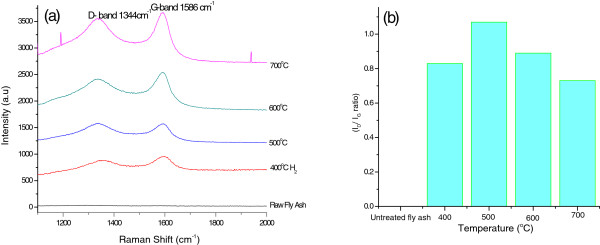
Figure 3.

Raman spectra and ID/IG ratios. (a) Laser Raman spectra of as-received coal fly ash and the products from fly ash exposed to acetylene at various temperatures. (b)ID/IG ratios of the CNFs synthesized in acetylene. The D and G band peaks confirmed the formation of CNFs that were identified by TEM. CNFs at 500°C displayed the highest degree of disorder.
