
Figure 4.
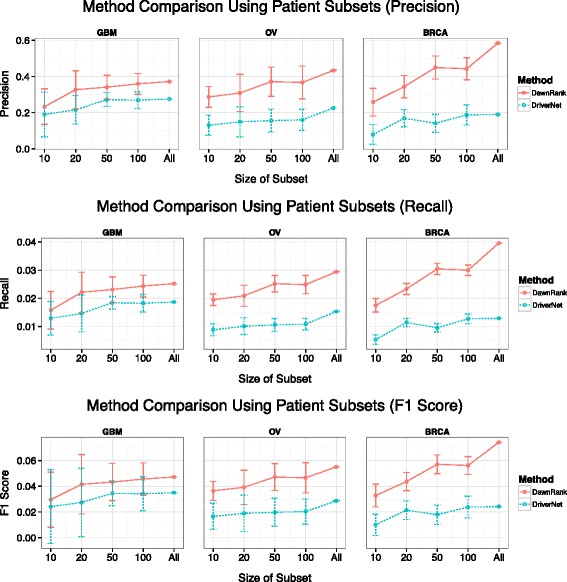
Comparison results using subset of patient samples. The figure shows the precision, recall, and F1 scores of the DawnRank and DriverNet results in determining known drivers among their top 30 genes using a small subset of the patient samples (X-axis) rather than the entire cohort. The Y-axis represents the average precision of 10 runs using the subset. The error bars show the 1-standard deviation range of each data point.