
Figure 6.
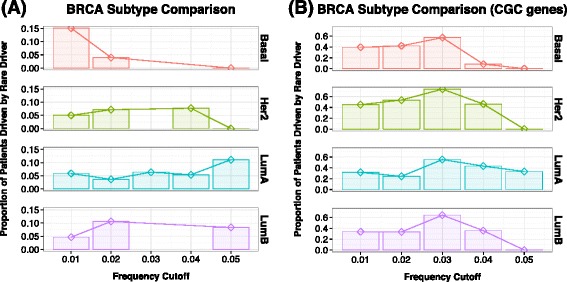
Distribution of rare drivers (A) and known drivers (B) across four breast cancer subtypes. The X-axis describes the frequency cutoffs (1% to 5%). Note that this cutoff is not cumulative. The Y-axis shows the proportion of patient samples that have rare drivers within that frequency cutoff.