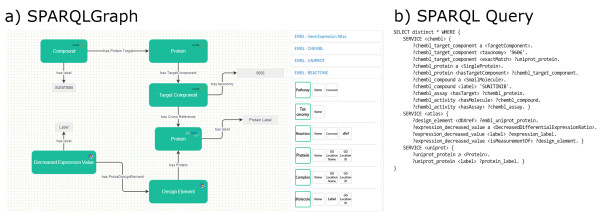
Figure 1.

Graphical and textual representation of an example query. a) Displayed are the drawing board (left) and the element selection panel (right). Elements (objects and subjects) of the query are represented as green boxes that display the corresponding database in the top right corner. Relations between elements are represented as arrows and display the proper description. Properties of elements are represented as grey boxes. The depicted graph represents a federated query including three different databases (see example use case); b) shows the corresponding SPARQL query that is automatically generated by the system and executed at an endpoint.
